29
/pt/
pt
AIzaSyAYiBZKx7MnpbEhh9jyipgxe19OcubqV5w
April 1, 2024
113654
Cote d'Ivoire
CIV
true
2
1
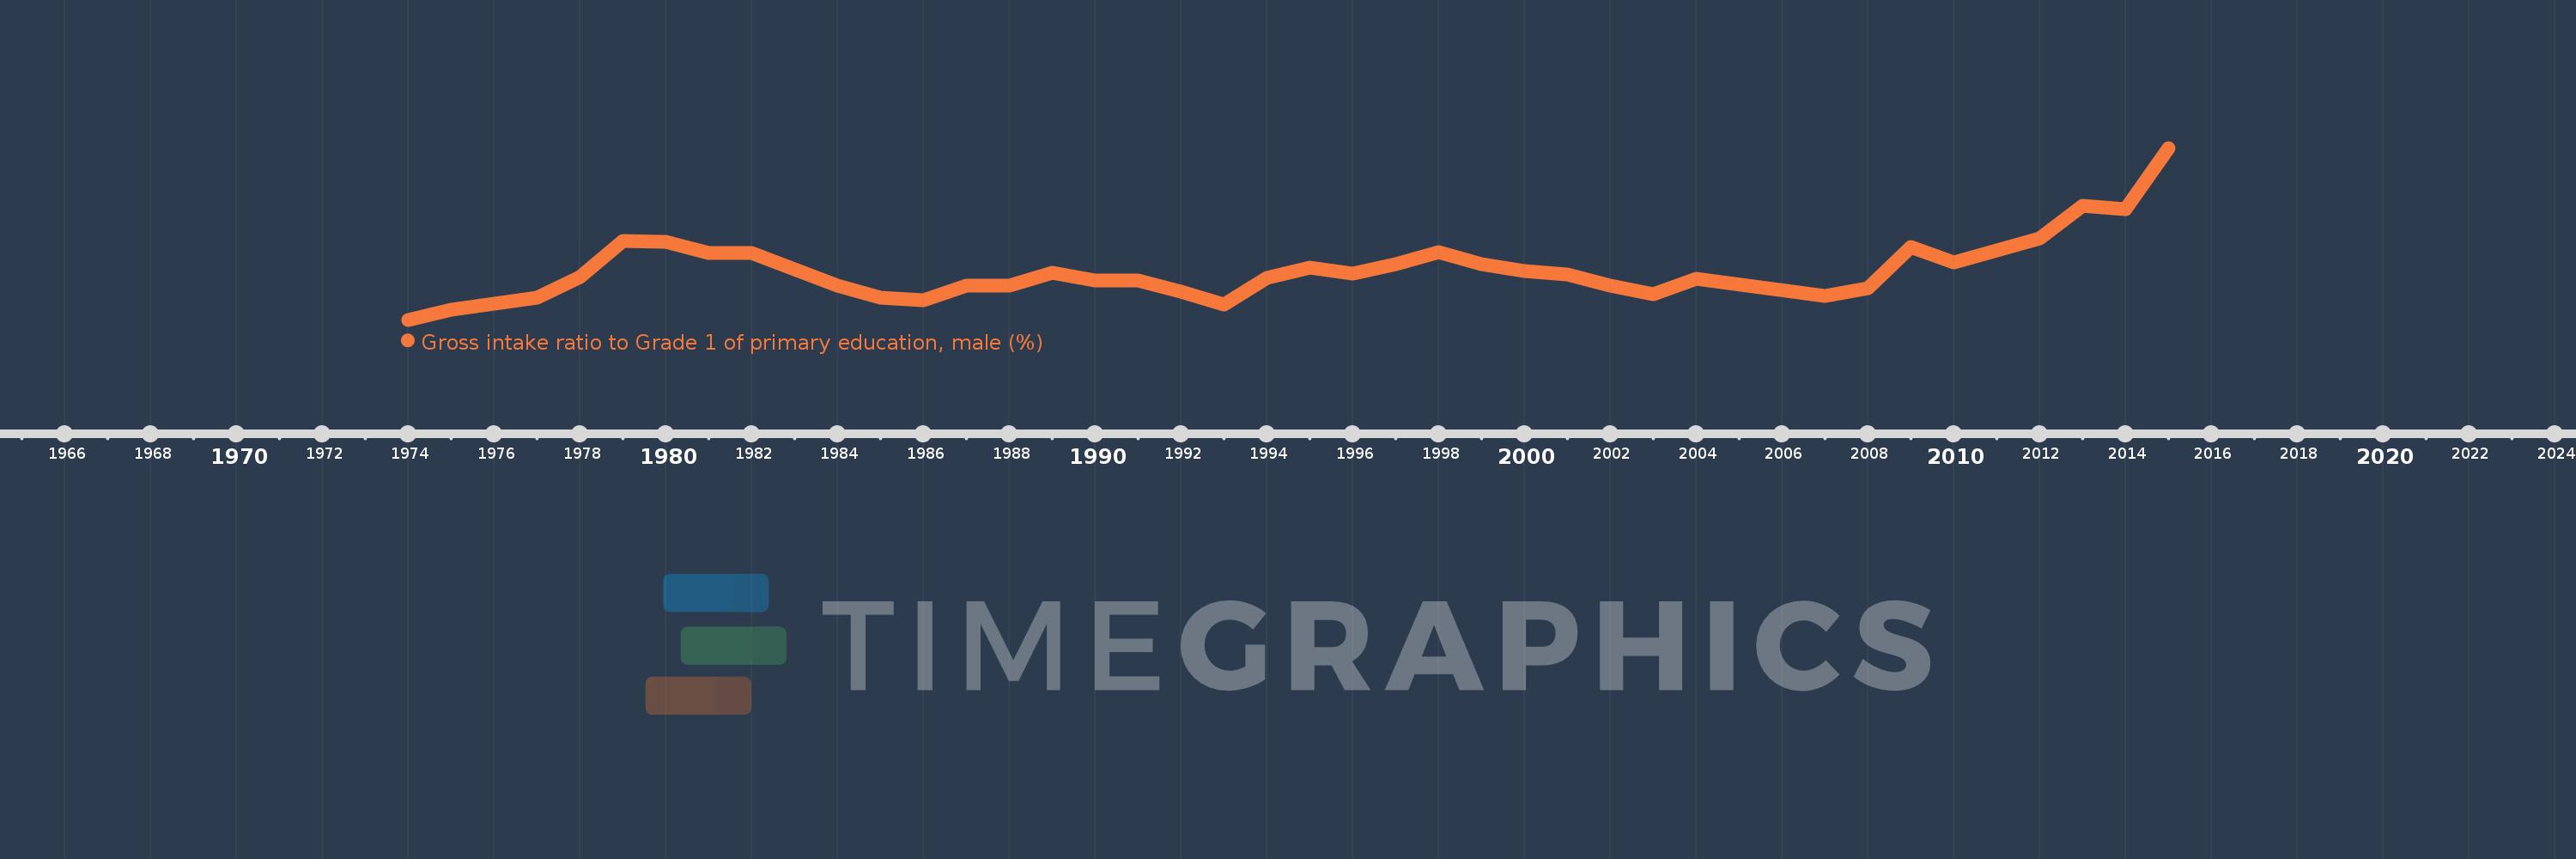
Gross intake ratio to Grade 1 of primary education, male (%)
2015,2014,2013,2012,2010,2009,2008,2007,2004,2003,2002,2001,2000,1999,1998,1997,1996,1995,1994,1993,1992,1991,1990,1989,1988,1987,1986,1985,1984,1982,1981,1980,1979,1978,1977,1975,1974
Estas estatísticas em outros países:
AfghanistanAlbaniaAlgeriaAngolaAntigua and BarbudaArab WorldArgentinaArmeniaArubaAustriaAzerbaijanBahamas, TheBahrainBangladeshBarbadosBelarusBelgiumBelizeBeninBermudaBhutanBoliviaBosnia and HerzegovinaBotswanaBrazilBrunei DarussalamBulgariaBurkina FasoBurundiCabo VerdeCambodiaCameroonCanadaCaribbean small statesCentral African RepublicCentral Europe and the BalticsChadChileChinaColombiaComorosCongo, Dem. Rep.Congo, Rep.Costa RicaCote d'IvoireCroatiaCubaCyprusCzech RepublicDenmarkDjiboutiDominicaDominican RepublicEarly-demographic dividendEast Asia & PacificEast Asia & Pacific (excluding high income)East Asia & Pacific (IDA & IBRD countries)EcuadorEgypt, Arab Rep.El SalvadorEquatorial GuineaEritreaEstoniaEthiopiaEuro areaEurope & Central AsiaEurope & Central Asia (excluding high income)Europe & Central Asia (IDA & IBRD countries)European UnionFijiFinlandFragile and conflict affected situationsFranceGabonGambia, TheGeorgiaGermanyGhanaGreeceGrenadaGuatemalaGuineaGuinea-BissauGuyanaHaitiHeavily indebted poor countries (HIPC)High incomeHondurasHong Kong SAR, ChinaHungaryIBRD onlyIcelandIDA & IBRD totalIDA blendIDA onlyIDA totalIndiaIndonesiaIran, Islamic Rep.IraqIrelandIsraelItalyJamaicaJapanJordanKazakhstanKenyaKiribatiKorea, Dem. People’s Rep.Korea, Rep.KuwaitKyrgyz RepublicLao PDRLate-demographic dividendLatin America & Caribbean Latin America & Caribbean (excluding high income)Latin America & the Caribbean (IDA & IBRD countries)LatviaLeast developed countries: UN classificationLebanonLesothoLiberiaLibyaLiechtensteinLithuaniaLow & middle incomeLow incomeLower middle incomeLuxembourgMacao SAR, ChinaMacedonia, FYRMadagascarMalawiMaldivesMaliMaltaMarshall IslandsMauritaniaMauritiusMexicoMicronesia, Fed. Sts.Middle East & North AfricaMiddle East & North Africa (excluding high income)Middle East & North Africa (IDA & IBRD countries)Middle incomeMoldovaMongoliaMontenegroMoroccoMozambiqueMyanmarNamibiaNauruNepalNetherlandsNew ZealandNicaraguaNigerNigeriaNorth AmericaNorwayOECD membersOmanOther small statesPacific island small statesPakistanPalauPanamaPapua New GuineaParaguayPeruPhilippinesPolandPortugalPost-demographic dividendPre-demographic dividendPuerto RicoQatarRomaniaRussian FederationRwandaSamoaSan MarinoSao Tome and PrincipeSaudi ArabiaSenegalSerbiaSeychellesSierra LeoneSlovak RepublicSloveniaSmall statesSolomon IslandsSouth AfricaSouth AsiaSouth Asia (IDA & IBRD)South SudanSpainSri LankaSt. Kitts and NevisSt. LuciaSt. Vincent and the GrenadinesSub-Saharan Africa Sub-Saharan Africa (excluding high income)Sub-Saharan Africa (IDA & IBRD countries)SudanSurinameSwazilandSwedenSwitzerlandSyrian Arab RepublicTajikistanTanzaniaThailandTimor-LesteTogoTongaTrinidad and TobagoTunisiaTurkeyTuvaluUgandaUkraineUnited Arab EmiratesUnited StatesUpper middle incomeUruguayUzbekistanVanuatuVenezuela, RBVietnamWest Bank and GazaWorldYemen, Rep.ZambiaZimbabwe Linha do tempo:
Nesta escala de tempo está apresentado um gráfico de 1974 ano até 2015 ano Cote d'Ivoire. Dados de 1973 ano ausente. O número de observações reais por data: 37.
Fonte (nome):
Indicadores de desenvolvimento mundial
Fonte (organização):
UNESCO Institute for Statistics
Categorias:
Education, Gender
Foi atualizado:
23 abr 2017 ano
Indicadores de alterações dos valores ao longo dos anos
Mínimo:
61.752
1 jan 1974 ano
Máximo:
103.242
1 jan 2015 ano
Na data de observação
Valor
Mudança absoluta
A alteração em relação ao valor anterior
1 jan 1974 ano
61.752
+61.752
0.0%
1 jan 1975 ano
64.11
+2.358
3.82%
1 jan 1977 ano
67.088
+2.978
4.65%
1 jan 1978 ano
72.164
+5.076
7.57%
1 jan 1979 ano
80.798
+8.634
11.96%
1 jan 1980 ano
80.585
-0.213
-0.26%
1 jan 1981 ano
77.919
-2.666
-3.31%
1 jan 1982 ano
77.818
-0.101
-0.13%
1 jan 1984 ano
69.986
-7.832
-10.06%
1 jan 1985 ano
67.003
-2.983
-4.26%
1 jan 1986 ano
66.437
-0.566
-0.84%
1 jan 1987 ano
69.906
+3.468
5.22%
1 jan 1988 ano
70.08
+0.174
0.25%
1 jan 1989 ano
73.062
+2.982
4.26%
1 jan 1990 ano
71.291
-1.771
-2.42%
1 jan 1991 ano
71.135
-0.155
-0.22%
1 jan 1992 ano
68.617
-2.518
-3.54%
1 jan 1993 ano
65.511
-3.106
-4.53%
1 jan 1994 ano
71.845
+6.334
9.67%
1 jan 1995 ano
74.398
+2.553
3.55%
1 jan 1996 ano
72.903
-1.496
-2.01%
1 jan 1997 ano
75.116
+2.213
3.04%
1 jan 1998 ano
78.055
+2.939
3.91%
1 jan 1999 ano
75.191
-2.864
-3.67%
1 jan 2000 ano
73.604
-1.587
-2.11%
1 jan 2001 ano
72.726
-0.878
-1.19%
1 jan 2002 ano
69.988
-2.738
-3.76%
1 jan 2003 ano
67.976
-2.013
-2.88%
1 jan 2004 ano
71.552
+3.577
5.26%
1 jan 2007 ano
67.532
-4.02
-5.62%
1 jan 2008 ano
69.402
+1.87
2.77%
1 jan 2009 ano
79.266
+9.864
14.21%
1 jan 2010 ano
75.487
-3.779
-4.77%
1 jan 2012 ano
81.381
+5.893
7.81%
1 jan 2013 ano
89.198
+7.817
9.61%
1 jan 2014 ano
88.513
-0.685
-0.77%
1 jan 2015 ano
103.242
+14.73
16.64%
Classificação de países por estatísticas atuais por anos


Comentários: