30
/pt/
AIzaSyAYiBZKx7MnpbEhh9jyipgxe19OcubqV5w
April 1, 2024
247612
Spain
ESP
true
2
1
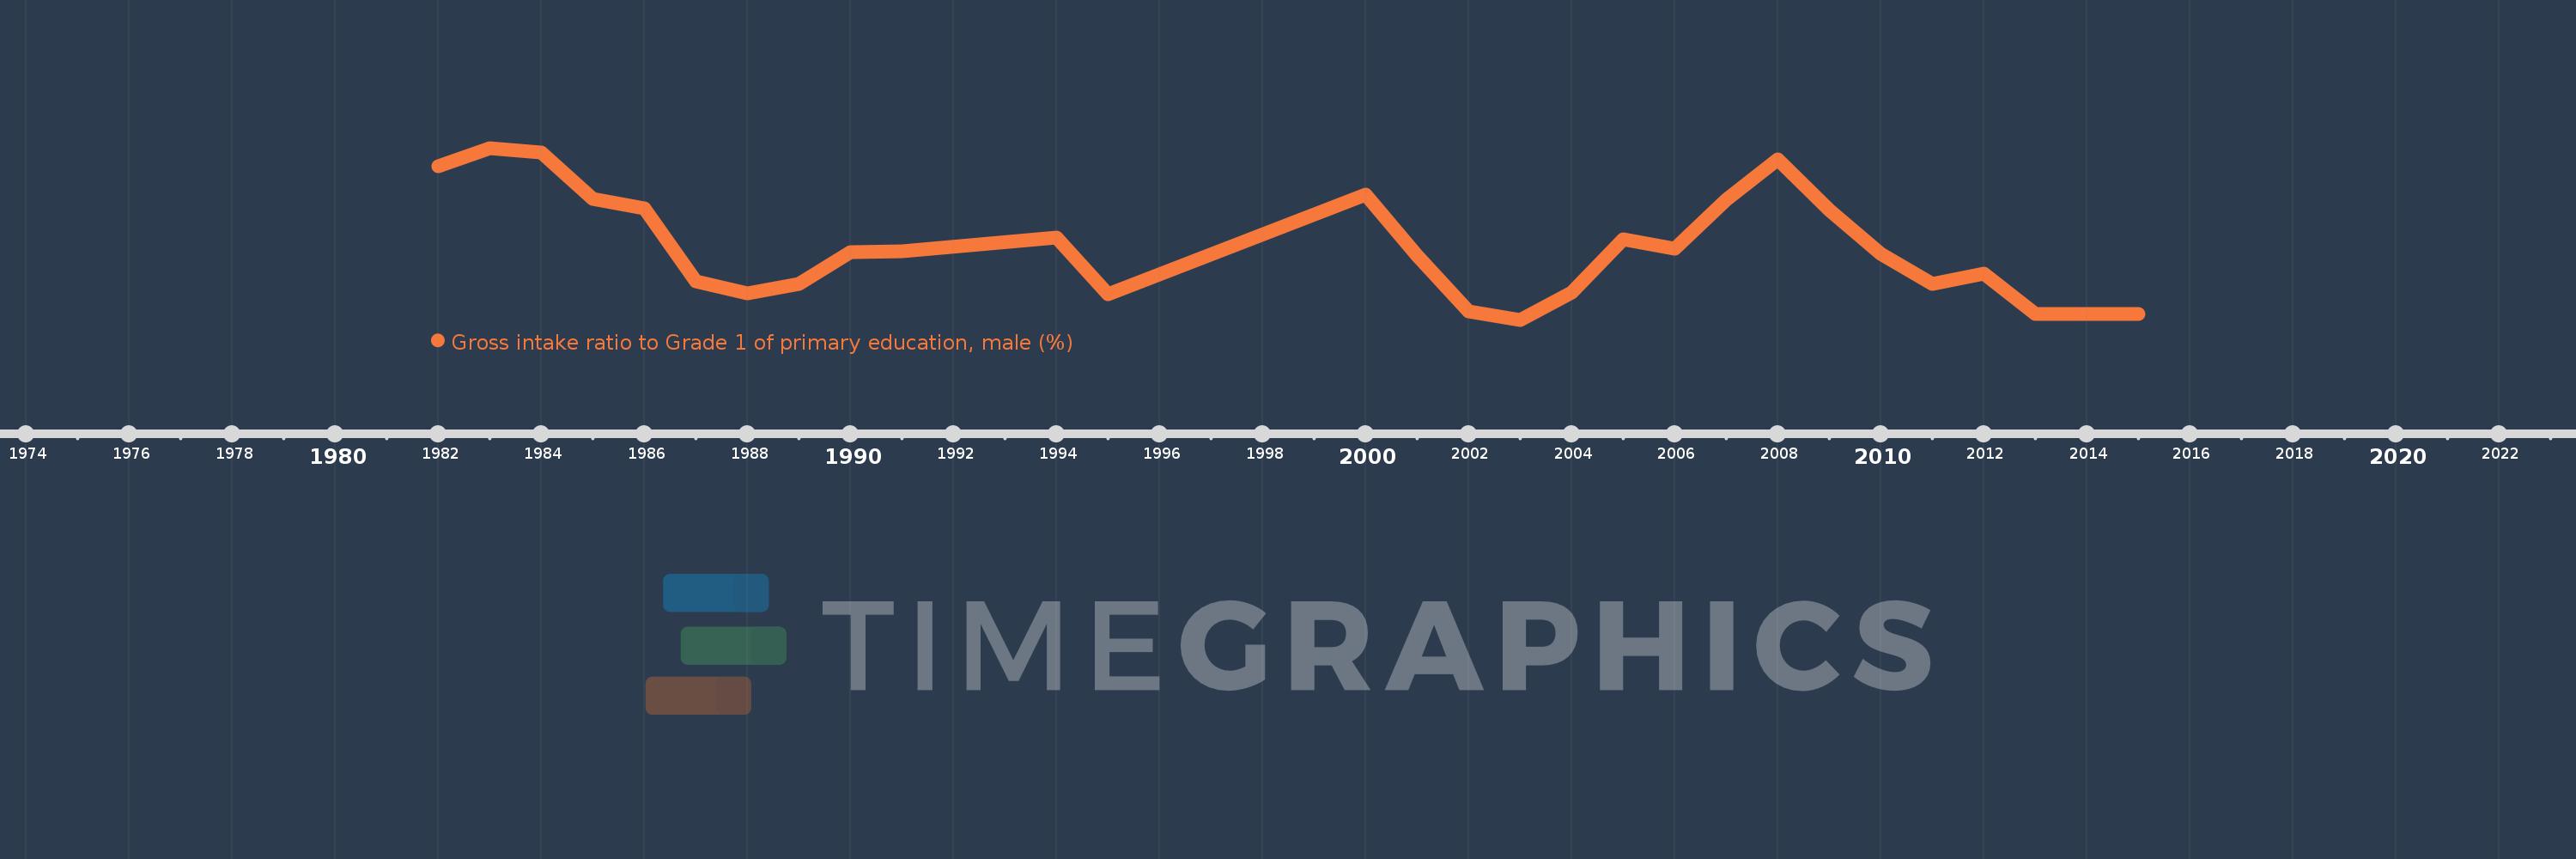
Gross intake ratio to Grade 1 of primary education, male (%)
2015,2013,2012,2011,2010,2009,2008,2007,2006,2005,2004,2003,2002,2001,2000,1995,1994,1991,1990,1989,1988,1987,1986,1985,1984,1983,1982
