29
/pt/
pt
AIzaSyAYiBZKx7MnpbEhh9jyipgxe19OcubqV5w
April 1, 2024
152596
Hungary
HUN
true
2
1
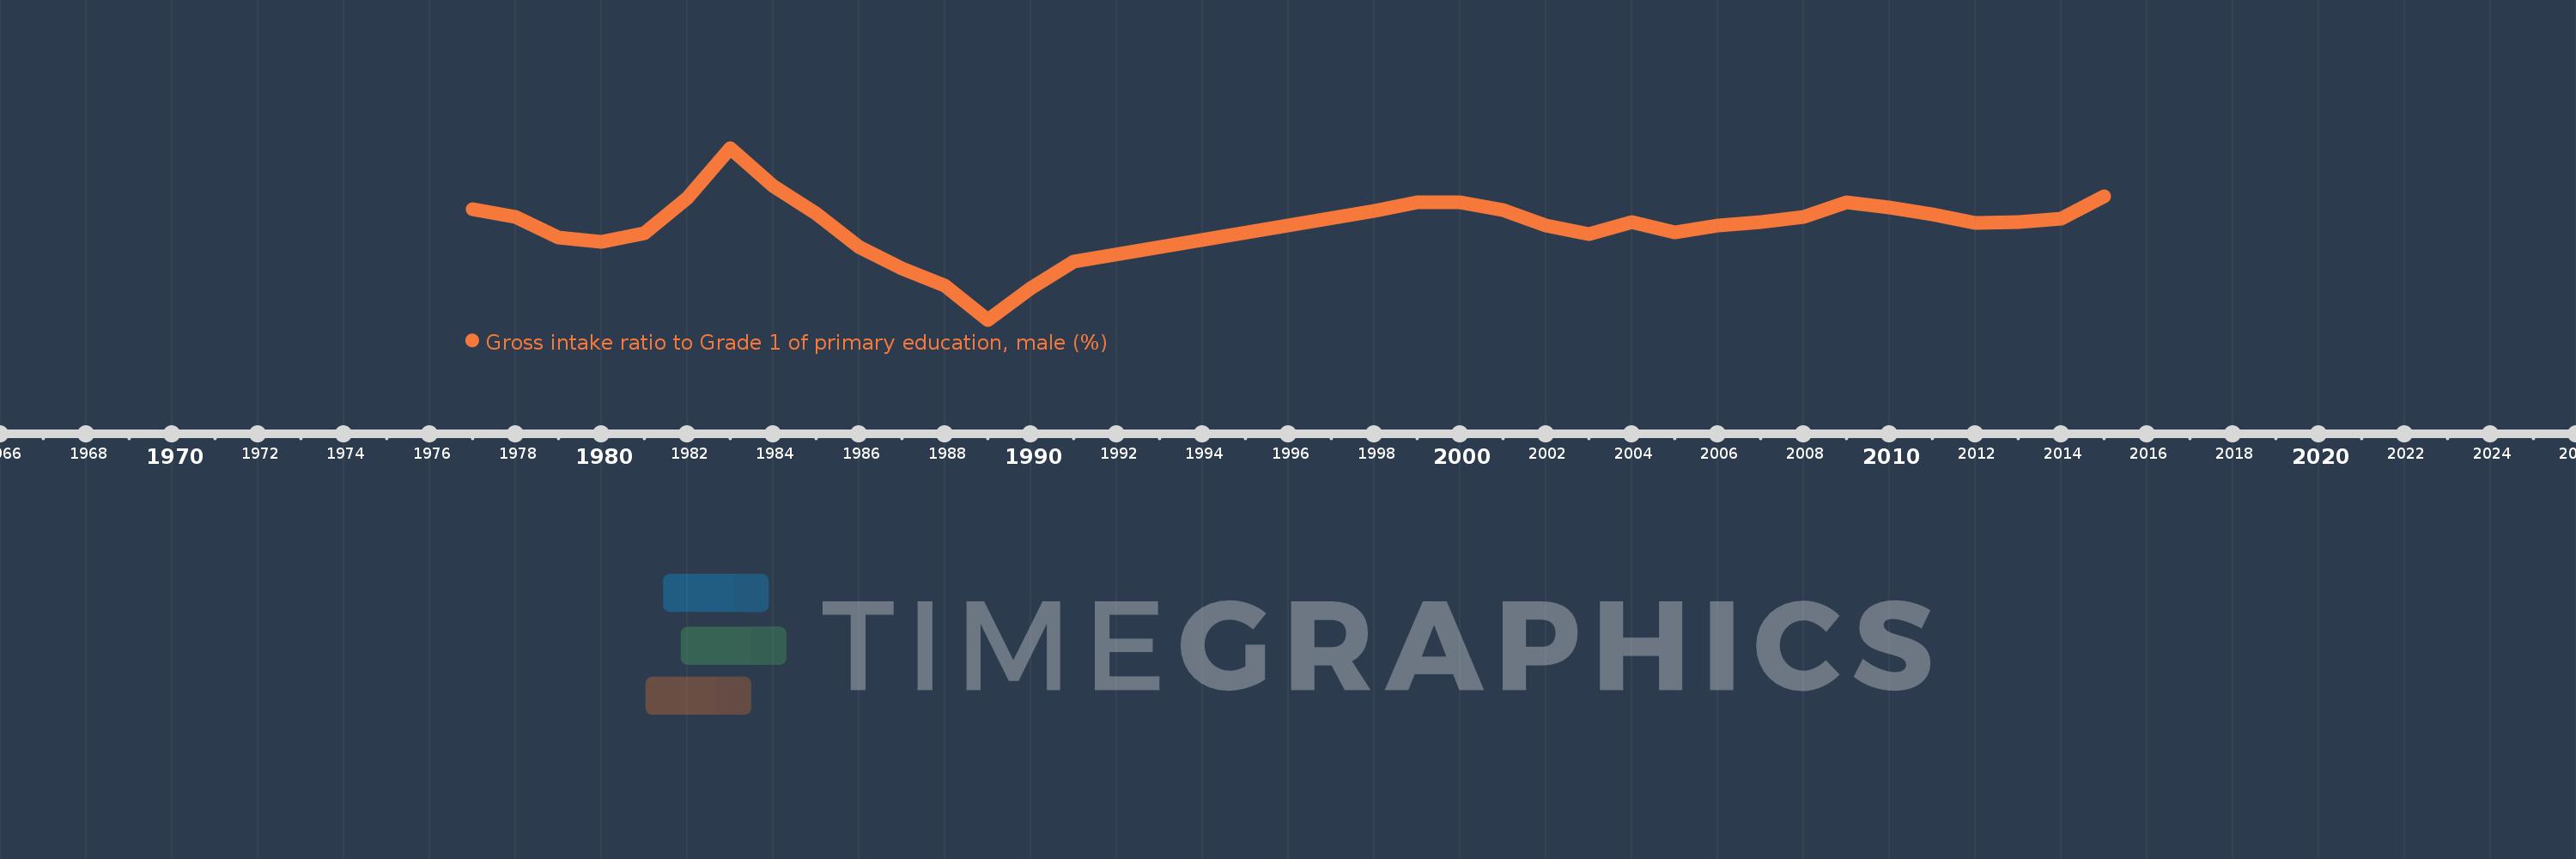
Gross intake ratio to Grade 1 of primary education, male (%)
2015,2014,2013,2012,2011,2010,2009,2008,2007,2006,2005,2004,2003,2002,2001,2000,1999,1998,1991,1990,1989,1988,1987,1986,1985,1984,1983,1982,1981,1980,1979,1978,1977
Estas estatísticas em outros países:
AfghanistanAlbaniaAlgeriaAngolaAntigua and BarbudaArab WorldArgentinaArmeniaArubaAustriaAzerbaijanBahamas, TheBahrainBangladeshBarbadosBelarusBelgiumBelizeBeninBermudaBhutanBoliviaBosnia and HerzegovinaBotswanaBrazilBrunei DarussalamBulgariaBurkina FasoBurundiCabo VerdeCambodiaCameroonCanadaCaribbean small statesCentral African RepublicCentral Europe and the BalticsChadChileChinaColombiaComorosCongo, Dem. Rep.Congo, Rep.Costa RicaCote d'IvoireCroatiaCubaCyprusCzech RepublicDenmarkDjiboutiDominicaDominican RepublicEarly-demographic dividendEast Asia & PacificEast Asia & Pacific (excluding high income)East Asia & Pacific (IDA & IBRD countries)EcuadorEgypt, Arab Rep.El SalvadorEquatorial GuineaEritreaEstoniaEthiopiaEuro areaEurope & Central AsiaEurope & Central Asia (excluding high income)Europe & Central Asia (IDA & IBRD countries)European UnionFijiFinlandFragile and conflict affected situationsFranceGabonGambia, TheGeorgiaGermanyGhanaGreeceGrenadaGuatemalaGuineaGuinea-BissauGuyanaHaitiHeavily indebted poor countries (HIPC)High incomeHondurasHong Kong SAR, ChinaHungaryIBRD onlyIcelandIDA & IBRD totalIDA blendIDA onlyIDA totalIndiaIndonesiaIran, Islamic Rep.IraqIrelandIsraelItalyJamaicaJapanJordanKazakhstanKenyaKiribatiKorea, Dem. People’s Rep.Korea, Rep.KuwaitKyrgyz RepublicLao PDRLate-demographic dividendLatin America & Caribbean Latin America & Caribbean (excluding high income)Latin America & the Caribbean (IDA & IBRD countries)LatviaLeast developed countries: UN classificationLebanonLesothoLiberiaLibyaLiechtensteinLithuaniaLow & middle incomeLow incomeLower middle incomeLuxembourgMacao SAR, ChinaMacedonia, FYRMadagascarMalawiMaldivesMaliMaltaMarshall IslandsMauritaniaMauritiusMexicoMicronesia, Fed. Sts.Middle East & North AfricaMiddle East & North Africa (excluding high income)Middle East & North Africa (IDA & IBRD countries)Middle incomeMoldovaMongoliaMontenegroMoroccoMozambiqueMyanmarNamibiaNauruNepalNetherlandsNew ZealandNicaraguaNigerNigeriaNorth AmericaNorwayOECD membersOmanOther small statesPacific island small statesPakistanPalauPanamaPapua New GuineaParaguayPeruPhilippinesPolandPortugalPost-demographic dividendPre-demographic dividendPuerto RicoQatarRomaniaRussian FederationRwandaSamoaSan MarinoSao Tome and PrincipeSaudi ArabiaSenegalSerbiaSeychellesSierra LeoneSlovak RepublicSloveniaSmall statesSolomon IslandsSouth AfricaSouth AsiaSouth Asia (IDA & IBRD)South SudanSpainSri LankaSt. Kitts and NevisSt. LuciaSt. Vincent and the GrenadinesSub-Saharan Africa Sub-Saharan Africa (excluding high income)Sub-Saharan Africa (IDA & IBRD countries)SudanSurinameSwazilandSwedenSwitzerlandSyrian Arab RepublicTajikistanTanzaniaThailandTimor-LesteTogoTongaTrinidad and TobagoTunisiaTurkeyTuvaluUgandaUkraineUnited Arab EmiratesUnited StatesUpper middle incomeUruguayUzbekistanVanuatuVenezuela, RBVietnamWest Bank and GazaWorldYemen, Rep.ZambiaZimbabwe Linha do tempo:
Nesta escala de tempo está apresentado um gráfico de 1977 ano até 2015 ano Hungary. Dados de 1976 ano ausente. O número de observações reais por data: 33.
Fonte (nome):
Indicadores de desenvolvimento mundial
Fonte (organização):
UNESCO Institute for Statistics
Categorias:
Education, Gender
Foi atualizado:
23 abr 2017 ano
Indicadores de alterações dos valores ao longo dos anos
Mínimo:
73.676
1 jan 1989 ano
Máximo:
118.698
1 jan 1983 ano
Na data de observação
Valor
Mudança absoluta
A alteração em relação ao valor anterior
1 jan 1977 ano
102.689
+102.689
0.0%
1 jan 1978 ano
100.62
-2.069
-2.01%
1 jan 1979 ano
95.28
-5.34
-5.31%
1 jan 1980 ano
94.169
-1.111
-1.17%
1 jan 1981 ano
96.406
+2.237
2.38%
1 jan 1982 ano
105.614
+9.208
9.55%
1 jan 1983 ano
118.698
+13.084
12.39%
1 jan 1984 ano
108.634
-10.064
-8.48%
1 jan 1985 ano
101.581
-7.052
-6.49%
1 jan 1986 ano
92.769
-8.812
-8.67%
1 jan 1987 ano
87.111
-5.658
-6.1%
1 jan 1988 ano
82.574
-4.538
-5.21%
1 jan 1989 ano
73.676
-8.898
-10.78%
1 jan 1990 ano
81.951
+8.275
11.23%
1 jan 1991 ano
88.836
+6.886
8.4%
1 jan 1998 ano
102.113
+13.276
14.94%
1 jan 1999 ano
104.369
+2.256
2.21%
1 jan 2000 ano
104.354
-0.015
-0.01%
1 jan 2001 ano
102.403
-1.951
-1.87%
1 jan 2002 ano
98.332
-4.072
-3.98%
1 jan 2003 ano
96.216
-2.116
-2.15%
1 jan 2004 ano
99.192
+2.976
3.09%
1 jan 2005 ano
96.631
-2.561
-2.58%
1 jan 2006 ano
98.388
+1.758
1.82%
1 jan 2007 ano
99.358
+0.969
0.99%
1 jan 2008 ano
100.66
+1.302
1.31%
1 jan 2009 ano
104.511
+3.852
3.83%
1 jan 2010 ano
103.13
-1.382
-1.32%
1 jan 2011 ano
101.196
-1.934
-1.87%
1 jan 2012 ano
99.0
-2.196
-2.17%
1 jan 2013 ano
99.329
+0.329
0.33%
1 jan 2014 ano
100.265
+0.936
0.94%
1 jan 2015 ano
106.1
+5.835
5.82%
Classificação de países por estatísticas atuais por anos


Comentários: