29
/pt/
pt
AIzaSyAYiBZKx7MnpbEhh9jyipgxe19OcubqV5w
April 1, 2024
33417
European Union
EUU
false
2
1
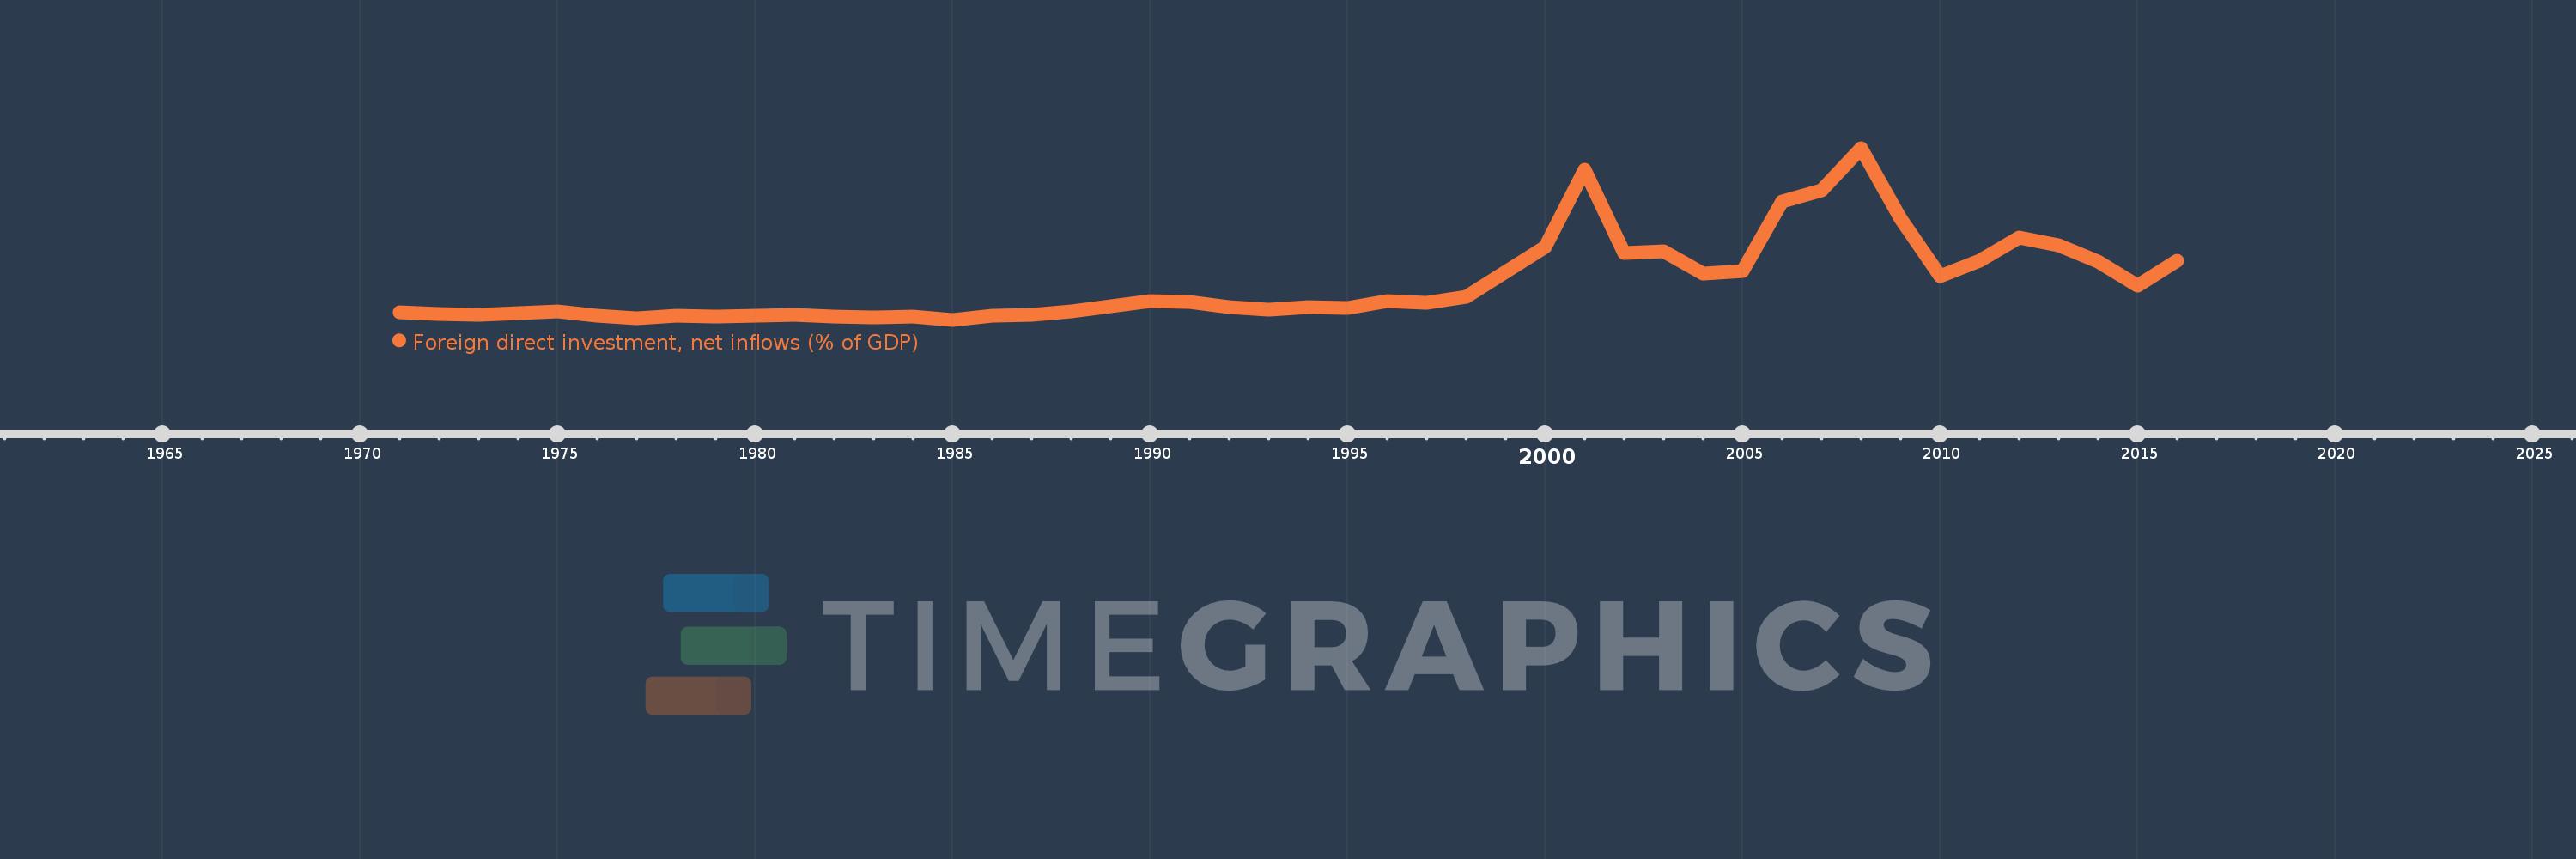
Foreign direct investment, net inflows (% of GDP)
2016,2015,2014,2013,2012,2011,2010,2009,2008,2007,2006,2005,2004,2003,2002,2001,2000,1999,1998,1997,1996,1995,1994,1993,1992,1991,1990,1989,1988,1987,1986,1985,1984,1983,1982,1981,1980,1979,1978,1977,1976,1975,1974,1973,1972,1971
Estas estatísticas em outros países:
AfghanistanAlbaniaAlgeriaAngolaAntigua and BarbudaArab WorldArgentinaArmeniaArubaAustraliaAustriaAzerbaijanBahamas, TheBahrainBangladeshBarbadosBelarusBelgiumBelizeBeninBermudaBhutanBoliviaBosnia and HerzegovinaBotswanaBrazilBrunei DarussalamBulgariaBurkina FasoBurundiCabo VerdeCambodiaCameroonCanadaCaribbean small statesCayman IslandsCentral African RepublicCentral Europe and the BalticsChadChileChinaColombiaComorosCongo, Dem. Rep.Congo, Rep.Costa RicaCote d'IvoireCroatiaCyprusCzech RepublicDenmarkDjiboutiDominicaDominican RepublicEarly-demographic dividendEast Asia & PacificEast Asia & Pacific (excluding high income)East Asia & Pacific (IDA & IBRD countries)EcuadorEgypt, Arab Rep.El SalvadorEquatorial GuineaEritreaEstoniaEthiopiaEuro areaEurope & Central AsiaEurope & Central Asia (excluding high income)Europe & Central Asia (IDA & IBRD countries)European UnionFijiFinlandFragile and conflict affected situationsFranceFrench PolynesiaGabonGambia, TheGeorgiaGermanyGhanaGreeceGrenadaGuatemalaGuineaGuinea-BissauGuyanaHaitiHeavily indebted poor countries (HIPC)High incomeHondurasHong Kong SAR, ChinaHungaryIBRD onlyIcelandIDA & IBRD totalIDA blendIDA onlyIDA totalIndiaIndonesiaIran, Islamic Rep.IraqIrelandIsraelItalyJamaicaJapanJordanKazakhstanKenyaKiribatiKorea, Rep.KosovoKuwaitKyrgyz RepublicLao PDRLate-demographic dividendLatin America & Caribbean Latin America & Caribbean (excluding high income)Latin America & the Caribbean (IDA & IBRD countries)LatviaLeast developed countries: UN classificationLebanonLesothoLiberiaLibyaLithuaniaLow & middle incomeLow incomeLower middle incomeLuxembourgMacao SAR, ChinaMacedonia, FYRMadagascarMalawiMalaysiaMaldivesMaliMaltaMarshall IslandsMauritaniaMauritiusMexicoMicronesia, Fed. Sts.Middle East & North AfricaMiddle East & North Africa (excluding high income)Middle East & North Africa (IDA & IBRD countries)Middle incomeMoldovaMongoliaMontenegroMoroccoMozambiqueMyanmarNamibiaNauruNepalNetherlandsNew CaledoniaNew ZealandNicaraguaNigerNigeriaNorth AmericaNorwayOECD membersOmanOther small statesPacific island small statesPakistanPalauPanamaPapua New GuineaParaguayPeruPhilippinesPolandPortugalPost-demographic dividendPre-demographic dividendQatarRomaniaRussian FederationRwandaSamoaSao Tome and PrincipeSaudi ArabiaSenegalSerbiaSeychellesSierra LeoneSingaporeSlovak RepublicSloveniaSmall statesSolomon IslandsSomaliaSouth AfricaSouth AsiaSouth Asia (IDA & IBRD)South SudanSpainSri LankaSt. Kitts and NevisSt. LuciaSt. Vincent and the GrenadinesSub-Saharan Africa Sub-Saharan Africa (excluding high income)Sub-Saharan Africa (IDA & IBRD countries)SudanSurinameSwazilandSwedenSwitzerlandSyrian Arab RepublicTajikistanTanzaniaThailandTimor-LesteTogoTongaTrinidad and TobagoTunisiaTurkeyTurkmenistanTuvaluUgandaUkraineUnited Arab EmiratesUnited KingdomUnited StatesUpper middle incomeUruguayUzbekistanVanuatuVenezuela, RBVietnamWest Bank and GazaWorldYemen, Rep.ZambiaZimbabwe Linha do tempo:
Nesta escala de tempo está apresentado um gráfico de 1971 ano até 2016 ano European Union. Dados de 1970 ano ausente. O número de observações reais por data: 46.
Fonte (nome):
Indicadores de desenvolvimento mundial
Fonte (organização):
International Monetary Fund, International Financial Statistics and Balance of Payments databases, World Bank, International Debt Statistics, and World Bank and OECD GDP estimates.
Categorias:
Economy & Growth, Financial Sector, Climate Change
Foi atualizado:
23 abr 2017 ano
Indicadores de alterações dos valores ao longo dos anos
Mínimo:
0.309
1 jan 1985 ano
Máximo:
9.357
1 jan 2008 ano
Na data de observação
Valor
Mudança absoluta
A alteração em relação ao valor anterior
1 jan 1971 ano
0.699
+0.699
0.0%
1 jan 1972 ano
0.604
-0.095
-13.61%
1 jan 1973 ano
0.563
-0.041
-6.86%
1 jan 1974 ano
0.646
+0.084
14.89%
1 jan 1975 ano
0.734
+0.088
13.58%
1 jan 1976 ano
0.503
-0.231
-31.53%
1 jan 1977 ano
0.381
-0.121
-24.17%
1 jan 1978 ano
0.506
+0.125
32.87%
1 jan 1979 ano
0.465
-0.041
-8.17%
1 jan 1980 ano
0.511
+0.046
9.88%
1 jan 1981 ano
0.558
+0.047
9.14%
1 jan 1982 ano
0.474
-0.084
-15.0%
1 jan 1983 ano
0.425
-0.049
-10.37%
1 jan 1984 ano
0.479
+0.054
12.8%
1 jan 1985 ano
0.309
-0.17
-35.58%
1 jan 1986 ano
0.515
+0.207
66.96%
1 jan 1987 ano
0.569
+0.053
10.35%
1 jan 1988 ano
0.754
+0.185
32.49%
1 jan 1989 ano
1.0
+0.246
32.69%
1 jan 1990 ano
1.31
+0.31
31.02%
1 jan 1991 ano
1.244
-0.066
-5.06%
1 jan 1992 ano
0.952
-0.292
-23.44%
1 jan 1993 ano
0.835
-0.117
-12.32%
1 jan 1994 ano
0.98
+0.145
17.37%
1 jan 1995 ano
0.942
-0.038
-3.89%
1 jan 1996 ano
1.297
+0.356
37.75%
1 jan 1997 ano
1.199
-0.098
-7.55%
1 jan 1998 ano
1.509
+0.31
25.82%
1 jan 1999 ano
2.836
+1.327
87.93%
1 jan 2000 ano
4.159
+1.322
46.63%
1 jan 2001 ano
8.207
+4.049
97.35%
1 jan 2002 ano
3.823
-4.385
-53.43%
1 jan 2003 ano
3.901
+0.079
2.06%
1 jan 2004 ano
2.755
-1.146
-29.39%
1 jan 2005 ano
2.87
+0.116
4.19%
1 jan 2006 ano
6.561
+3.69
128.57%
1 jan 2007 ano
7.12
+0.559
8.52%
1 jan 2008 ano
9.357
+2.237
31.42%
1 jan 2009 ano
5.635
-3.722
-39.78%
1 jan 2010 ano
2.608
-3.027
-53.72%
1 jan 2011 ano
3.402
+0.794
30.46%
1 jan 2012 ano
4.642
+1.24
36.44%
1 jan 2013 ano
4.245
-0.397
-8.55%
1 jan 2014 ano
3.365
-0.88
-20.73%
1 jan 2015 ano
2.108
-1.257
-37.36%
1 jan 2016 ano
3.403
+1.295
61.46%
Classificação de países por estatísticas atuais por anos


Comentários: