29
/pt/
pt
AIzaSyAYiBZKx7MnpbEhh9jyipgxe19OcubqV5w
April 1, 2024
195531
Mexico
MEX
true
2
1
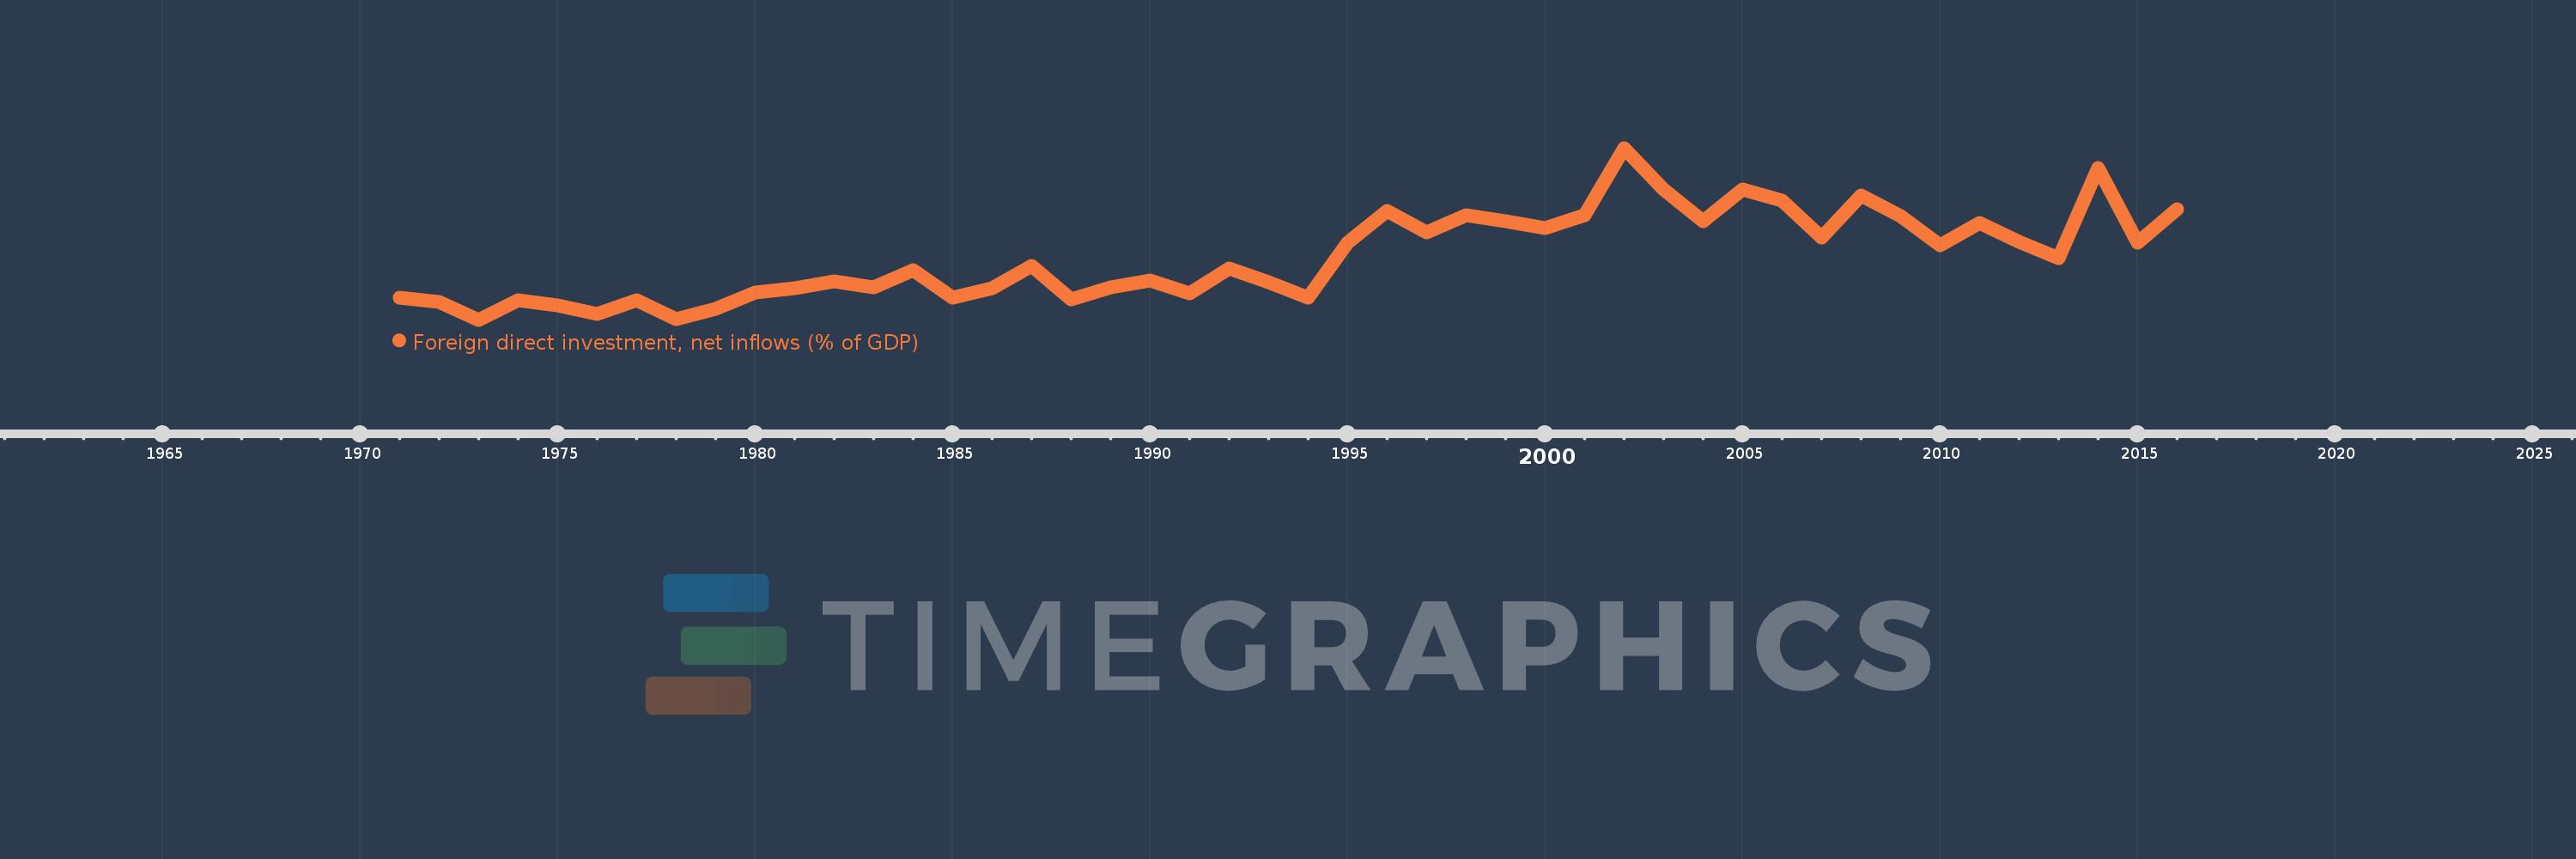
Foreign direct investment, net inflows (% of GDP)
2016,2015,2014,2013,2012,2011,2010,2009,2008,2007,2006,2005,2004,2003,2002,2001,2000,1999,1998,1997,1996,1995,1994,1993,1992,1991,1990,1989,1988,1987,1986,1985,1984,1983,1982,1981,1980,1979,1978,1977,1976,1975,1974,1973,1972,1971
Estas estatísticas em outros países:
AfghanistanAlbaniaAlgeriaAngolaAntigua and BarbudaArab WorldArgentinaArmeniaArubaAustraliaAustriaAzerbaijanBahamas, TheBahrainBangladeshBarbadosBelarusBelgiumBelizeBeninBermudaBhutanBoliviaBosnia and HerzegovinaBotswanaBrazilBrunei DarussalamBulgariaBurkina FasoBurundiCabo VerdeCambodiaCameroonCanadaCaribbean small statesCayman IslandsCentral African RepublicCentral Europe and the BalticsChadChileChinaColombiaComorosCongo, Dem. Rep.Congo, Rep.Costa RicaCote d'IvoireCroatiaCyprusCzech RepublicDenmarkDjiboutiDominicaDominican RepublicEarly-demographic dividendEast Asia & PacificEast Asia & Pacific (excluding high income)East Asia & Pacific (IDA & IBRD countries)EcuadorEgypt, Arab Rep.El SalvadorEquatorial GuineaEritreaEstoniaEthiopiaEuro areaEurope & Central AsiaEurope & Central Asia (excluding high income)Europe & Central Asia (IDA & IBRD countries)European UnionFijiFinlandFragile and conflict affected situationsFranceFrench PolynesiaGabonGambia, TheGeorgiaGermanyGhanaGreeceGrenadaGuatemalaGuineaGuinea-BissauGuyanaHaitiHeavily indebted poor countries (HIPC)High incomeHondurasHong Kong SAR, ChinaHungaryIBRD onlyIcelandIDA & IBRD totalIDA blendIDA onlyIDA totalIndiaIndonesiaIran, Islamic Rep.IraqIrelandIsraelItalyJamaicaJapanJordanKazakhstanKenyaKiribatiKorea, Rep.KosovoKuwaitKyrgyz RepublicLao PDRLate-demographic dividendLatin America & Caribbean Latin America & Caribbean (excluding high income)Latin America & the Caribbean (IDA & IBRD countries)LatviaLeast developed countries: UN classificationLebanonLesothoLiberiaLibyaLithuaniaLow & middle incomeLow incomeLower middle incomeLuxembourgMacao SAR, ChinaMacedonia, FYRMadagascarMalawiMalaysiaMaldivesMaliMaltaMarshall IslandsMauritaniaMauritiusMexicoMicronesia, Fed. Sts.Middle East & North AfricaMiddle East & North Africa (excluding high income)Middle East & North Africa (IDA & IBRD countries)Middle incomeMoldovaMongoliaMontenegroMoroccoMozambiqueMyanmarNamibiaNauruNepalNetherlandsNew CaledoniaNew ZealandNicaraguaNigerNigeriaNorth AmericaNorwayOECD membersOmanOther small statesPacific island small statesPakistanPalauPanamaPapua New GuineaParaguayPeruPhilippinesPolandPortugalPost-demographic dividendPre-demographic dividendQatarRomaniaRussian FederationRwandaSamoaSao Tome and PrincipeSaudi ArabiaSenegalSerbiaSeychellesSierra LeoneSingaporeSlovak RepublicSloveniaSmall statesSolomon IslandsSomaliaSouth AfricaSouth AsiaSouth Asia (IDA & IBRD)South SudanSpainSri LankaSt. Kitts and NevisSt. LuciaSt. Vincent and the GrenadinesSub-Saharan Africa Sub-Saharan Africa (excluding high income)Sub-Saharan Africa (IDA & IBRD countries)SudanSurinameSwazilandSwedenSwitzerlandSyrian Arab RepublicTajikistanTanzaniaThailandTimor-LesteTogoTongaTrinidad and TobagoTunisiaTurkeyTurkmenistanTuvaluUgandaUkraineUnited Arab EmiratesUnited KingdomUnited StatesUpper middle incomeUruguayUzbekistanVanuatuVenezuela, RBVietnamWest Bank and GazaWorldYemen, Rep.ZambiaZimbabwe Linha do tempo:
Nesta escala de tempo está apresentado um gráfico de 1971 ano até 2016 ano Mexico. Dados de 1970 ano ausente. O número de observações reais por data: 46.
Fonte (nome):
Indicadores de desenvolvimento mundial
Fonte (organização):
International Monetary Fund, International Financial Statistics and Balance of Payments databases, World Bank, International Debt Statistics, and World Bank and OECD GDP estimates.
Categorias:
Economy & Growth, Financial Sector, Climate Change
Foi atualizado:
23 abr 2017 ano
Indicadores de alterações dos valores ao longo dos anos
Mínimo:
0.395
1 jan 1973 ano
Máximo:
4.147
1 jan 2002 ano
Na data de observação
Valor
Mudança absoluta
A alteração em relação ao valor anterior
1 jan 1971 ano
0.878
+0.878
0.0%
1 jan 1972 ano
0.783
-0.095
-10.82%
1 jan 1973 ano
0.395
-0.388
-49.58%
1 jan 1974 ano
0.827
+0.432
109.4%
1 jan 1975 ano
0.707
-0.12
-14.51%
1 jan 1976 ano
0.521
-0.186
-26.31%
1 jan 1977 ano
0.822
+0.301
57.73%
1 jan 1978 ano
0.4
-0.422
-51.35%
1 jan 1979 ano
0.642
+0.242
60.6%
1 jan 1980 ano
0.99
+0.348
54.21%
1 jan 1981 ano
1.075
+0.085
8.62%
1 jan 1982 ano
1.231
+0.155
14.46%
1 jan 1983 ano
1.094
-0.137
-11.09%
1 jan 1984 ano
1.472
+0.378
34.56%
1 jan 1985 ano
0.878
-0.594
-40.37%
1 jan 1986 ano
1.075
+0.198
22.5%
1 jan 1987 ano
1.573
+0.497
46.25%
1 jan 1988 ano
0.844
-0.729
-46.33%
1 jan 1989 ano
1.098
+0.254
30.08%
1 jan 1990 ano
1.249
+0.151
13.75%
1 jan 1991 ano
0.97
-0.279
-22.32%
1 jan 1992 ano
1.508
+0.538
55.42%
1 jan 1993 ano
1.208
-0.3
-19.88%
1 jan 1994 ano
0.871
-0.337
-27.92%
1 jan 1995 ano
2.081
+1.21
138.93%
1 jan 1996 ano
2.771
+0.69
33.17%
1 jan 1997 ano
2.311
-0.46
-16.58%
1 jan 1998 ano
2.67
+0.358
15.51%
1 jan 1999 ano
2.541
-0.129
-4.82%
1 jan 2000 ano
2.395
-0.146
-5.73%
1 jan 2001 ano
2.679
+0.284
11.84%
1 jan 2002 ano
4.147
+1.468
54.81%
1 jan 2003 ano
3.243
-0.904
-21.81%
1 jan 2004 ano
2.555
-0.688
-21.23%
1 jan 2005 ano
3.234
+0.68
26.61%
1 jan 2006 ano
2.998
-0.237
-7.31%
1 jan 2007 ano
2.189
-0.809
-26.97%
1 jan 2008 ano
3.107
+0.918
41.92%
1 jan 2009 ano
2.665
-0.442
-14.21%
1 jan 2010 ano
2.017
-0.648
-24.31%
1 jan 2011 ano
2.517
+0.499
24.76%
1 jan 2012 ano
2.096
-0.42
-16.71%
1 jan 2013 ano
1.732
-0.365
-17.4%
1 jan 2014 ano
3.717
+1.985
114.62%
1 jan 2015 ano
2.076
-1.641
-44.15%
1 jan 2016 ano
2.803
+0.727
35.01%
Classificação de países por estatísticas atuais por anos


Comentários: