29
/pt/
pt
AIzaSyAYiBZKx7MnpbEhh9jyipgxe19OcubqV5w
April 1, 2024
157265
Iran, Islamic Rep.
IRN
true
2
1
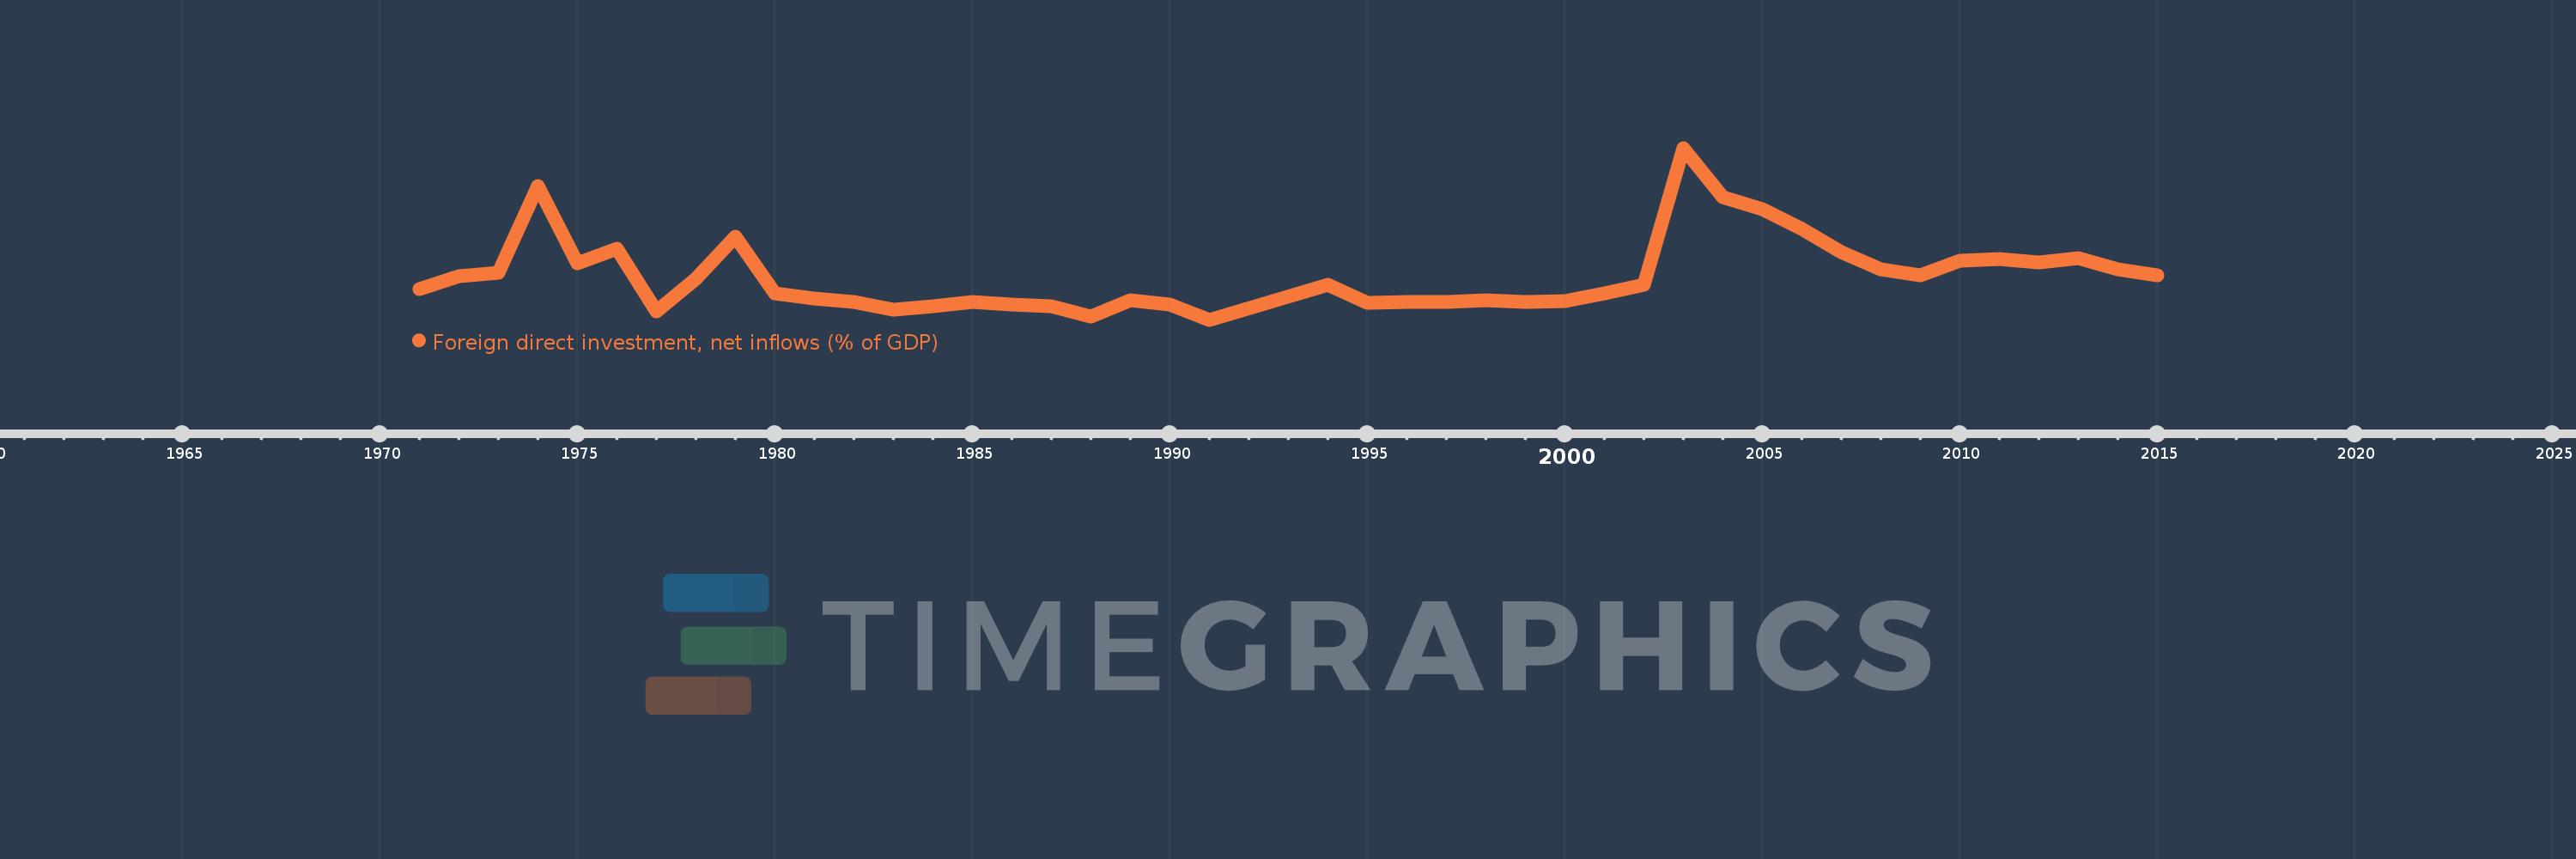
Foreign direct investment, net inflows (% of GDP)
2015,2014,2013,2012,2011,2010,2009,2008,2007,2006,2005,2004,2003,2002,2001,2000,1999,1998,1997,1996,1995,1994,1991,1990,1989,1988,1987,1986,1985,1984,1983,1982,1981,1980,1979,1978,1977,1976,1975,1974,1973,1972,1971
Estas estatísticas em outros países:
AfghanistanAlbaniaAlgeriaAngolaAntigua and BarbudaArab WorldArgentinaArmeniaArubaAustraliaAustriaAzerbaijanBahamas, TheBahrainBangladeshBarbadosBelarusBelgiumBelizeBeninBermudaBhutanBoliviaBosnia and HerzegovinaBotswanaBrazilBrunei DarussalamBulgariaBurkina FasoBurundiCabo VerdeCambodiaCameroonCanadaCaribbean small statesCayman IslandsCentral African RepublicCentral Europe and the BalticsChadChileChinaColombiaComorosCongo, Dem. Rep.Congo, Rep.Costa RicaCote d'IvoireCroatiaCyprusCzech RepublicDenmarkDjiboutiDominicaDominican RepublicEarly-demographic dividendEast Asia & PacificEast Asia & Pacific (excluding high income)East Asia & Pacific (IDA & IBRD countries)EcuadorEgypt, Arab Rep.El SalvadorEquatorial GuineaEritreaEstoniaEthiopiaEuro areaEurope & Central AsiaEurope & Central Asia (excluding high income)Europe & Central Asia (IDA & IBRD countries)European UnionFijiFinlandFragile and conflict affected situationsFranceFrench PolynesiaGabonGambia, TheGeorgiaGermanyGhanaGreeceGrenadaGuatemalaGuineaGuinea-BissauGuyanaHaitiHeavily indebted poor countries (HIPC)High incomeHondurasHong Kong SAR, ChinaHungaryIBRD onlyIcelandIDA & IBRD totalIDA blendIDA onlyIDA totalIndiaIndonesiaIran, Islamic Rep.IraqIrelandIsraelItalyJamaicaJapanJordanKazakhstanKenyaKiribatiKorea, Rep.KosovoKuwaitKyrgyz RepublicLao PDRLate-demographic dividendLatin America & Caribbean Latin America & Caribbean (excluding high income)Latin America & the Caribbean (IDA & IBRD countries)LatviaLeast developed countries: UN classificationLebanonLesothoLiberiaLibyaLithuaniaLow & middle incomeLow incomeLower middle incomeLuxembourgMacao SAR, ChinaMacedonia, FYRMadagascarMalawiMalaysiaMaldivesMaliMaltaMarshall IslandsMauritaniaMauritiusMexicoMicronesia, Fed. Sts.Middle East & North AfricaMiddle East & North Africa (excluding high income)Middle East & North Africa (IDA & IBRD countries)Middle incomeMoldovaMongoliaMontenegroMoroccoMozambiqueMyanmarNamibiaNauruNepalNetherlandsNew CaledoniaNew ZealandNicaraguaNigerNigeriaNorth AmericaNorwayOECD membersOmanOther small statesPacific island small statesPakistanPalauPanamaPapua New GuineaParaguayPeruPhilippinesPolandPortugalPost-demographic dividendPre-demographic dividendQatarRomaniaRussian FederationRwandaSamoaSao Tome and PrincipeSaudi ArabiaSenegalSerbiaSeychellesSierra LeoneSingaporeSlovak RepublicSloveniaSmall statesSolomon IslandsSomaliaSouth AfricaSouth AsiaSouth Asia (IDA & IBRD)South SudanSpainSri LankaSt. Kitts and NevisSt. LuciaSt. Vincent and the GrenadinesSub-Saharan Africa Sub-Saharan Africa (excluding high income)Sub-Saharan Africa (IDA & IBRD countries)SudanSurinameSwazilandSwedenSwitzerlandSyrian Arab RepublicTajikistanTanzaniaThailandTimor-LesteTogoTongaTrinidad and TobagoTunisiaTurkeyTurkmenistanTuvaluUgandaUkraineUnited Arab EmiratesUnited KingdomUnited StatesUpper middle incomeUruguayUzbekistanVanuatuVenezuela, RBVietnamWest Bank and GazaWorldYemen, Rep.ZambiaZimbabwe Linha do tempo:
Nesta escala de tempo está apresentado um gráfico de 1971 ano até 2015 ano Iran, Islamic Rep.. Dados de 1970 ano ausente. O número de observações reais por data: 43.
Fonte (nome):
Indicadores de desenvolvimento mundial
Fonte (organização):
International Monetary Fund, International Financial Statistics and Balance of Payments databases, World Bank, International Debt Statistics, and World Bank and OECD GDP estimates.
Categorias:
Economy & Growth, Financial Sector, Climate Change
Foi atualizado:
23 abr 2017 ano
Indicadores de alterações dos valores ao longo dos anos
Mínimo:
-0.29
1 jan 1991 ano
Máximo:
2.736
1 jan 2003 ano
Na data de observação
Valor
Mudança absoluta
A alteração em relação ao valor anterior
1 jan 1971 ano
0.255
+0.255
0.0%
1 jan 1972 ano
0.475
+0.22
86.13%
1 jan 1973 ano
0.532
+0.057
11.98%
1 jan 1974 ano
2.073
+1.542
289.97%
1 jan 1975 ano
0.7
-1.373
-66.23%
1 jan 1976 ano
0.955
+0.255
36.4%
1 jan 1977 ano
-0.149
-1.104
-115.63%
1 jan 1978 ano
0.429
+0.578
-387.32%
1 jan 1979 ano
1.166
+0.737
171.76%
1 jan 1980 ano
0.182
-0.984
-84.4%
1 jan 1981 ano
0.086
-0.096
-52.84%
1 jan 1982 ano
0.028
-0.058
-67.25%
1 jan 1983 ano
-0.108
-0.136
-484.8%
1 jan 1984 ano
-0.05
+0.058
-53.53%
1 jan 1985 ano
0.026
+0.077
-152.39%
1 jan 1986 ano
-0.021
-0.047
-180.48%
1 jan 1987 ano
-0.054
-0.033
153.98%
1 jan 1988 ano
-0.23
-0.176
326.89%
1 jan 1989 ano
0.049
+0.279
-121.43%
1 jan 1990 ano
-0.016
-0.065
-132.76%
1 jan 1991 ano
-0.29
-0.274
1.7 mil%
1 jan 1994 ano
0.326
+0.616
-212.28%
1 jan 1995 ano
0.003
-0.323
-99.14%
1 jan 1996 ano
0.018
+0.015
533.33%
1 jan 1997 ano
0.022
+0.004
22.47%
1 jan 1998 ano
0.047
+0.025
115.45%
1 jan 1999 ano
0.022
-0.025
-53.22%
1 jan 2000 ano
0.031
+0.009
41.26%
1 jan 2001 ano
0.177
+0.146
474.55%
1 jan 2002 ano
0.322
+0.145
82.11%
1 jan 2003 ano
2.736
+2.414
750.62%
1 jan 2004 ano
1.874
-0.862
-31.51%
1 jan 2005 ano
1.653
-0.221
-11.77%
1 jan 2006 ano
1.314
-0.339
-20.52%
1 jan 2007 ano
0.896
-0.418
-31.82%
1 jan 2008 ano
0.598
-0.298
-33.27%
1 jan 2009 ano
0.498
-0.099
-16.63%
1 jan 2010 ano
0.748
+0.249
50.0%
1 jan 2011 ano
0.78
+0.032
4.32%
1 jan 2012 ano
0.722
-0.058
-7.39%
1 jan 2013 ano
0.794
+0.072
9.9%
1 jan 2014 ano
0.596
-0.198
-24.91%
1 jan 2015 ano
0.495
-0.101
-16.96%
Classificação de países por estatísticas atuais por anos


Comentários: