29
/pt/
pt
AIzaSyAYiBZKx7MnpbEhh9jyipgxe19OcubqV5w
April 1, 2024
264582
Togo
TGO
true
2
1
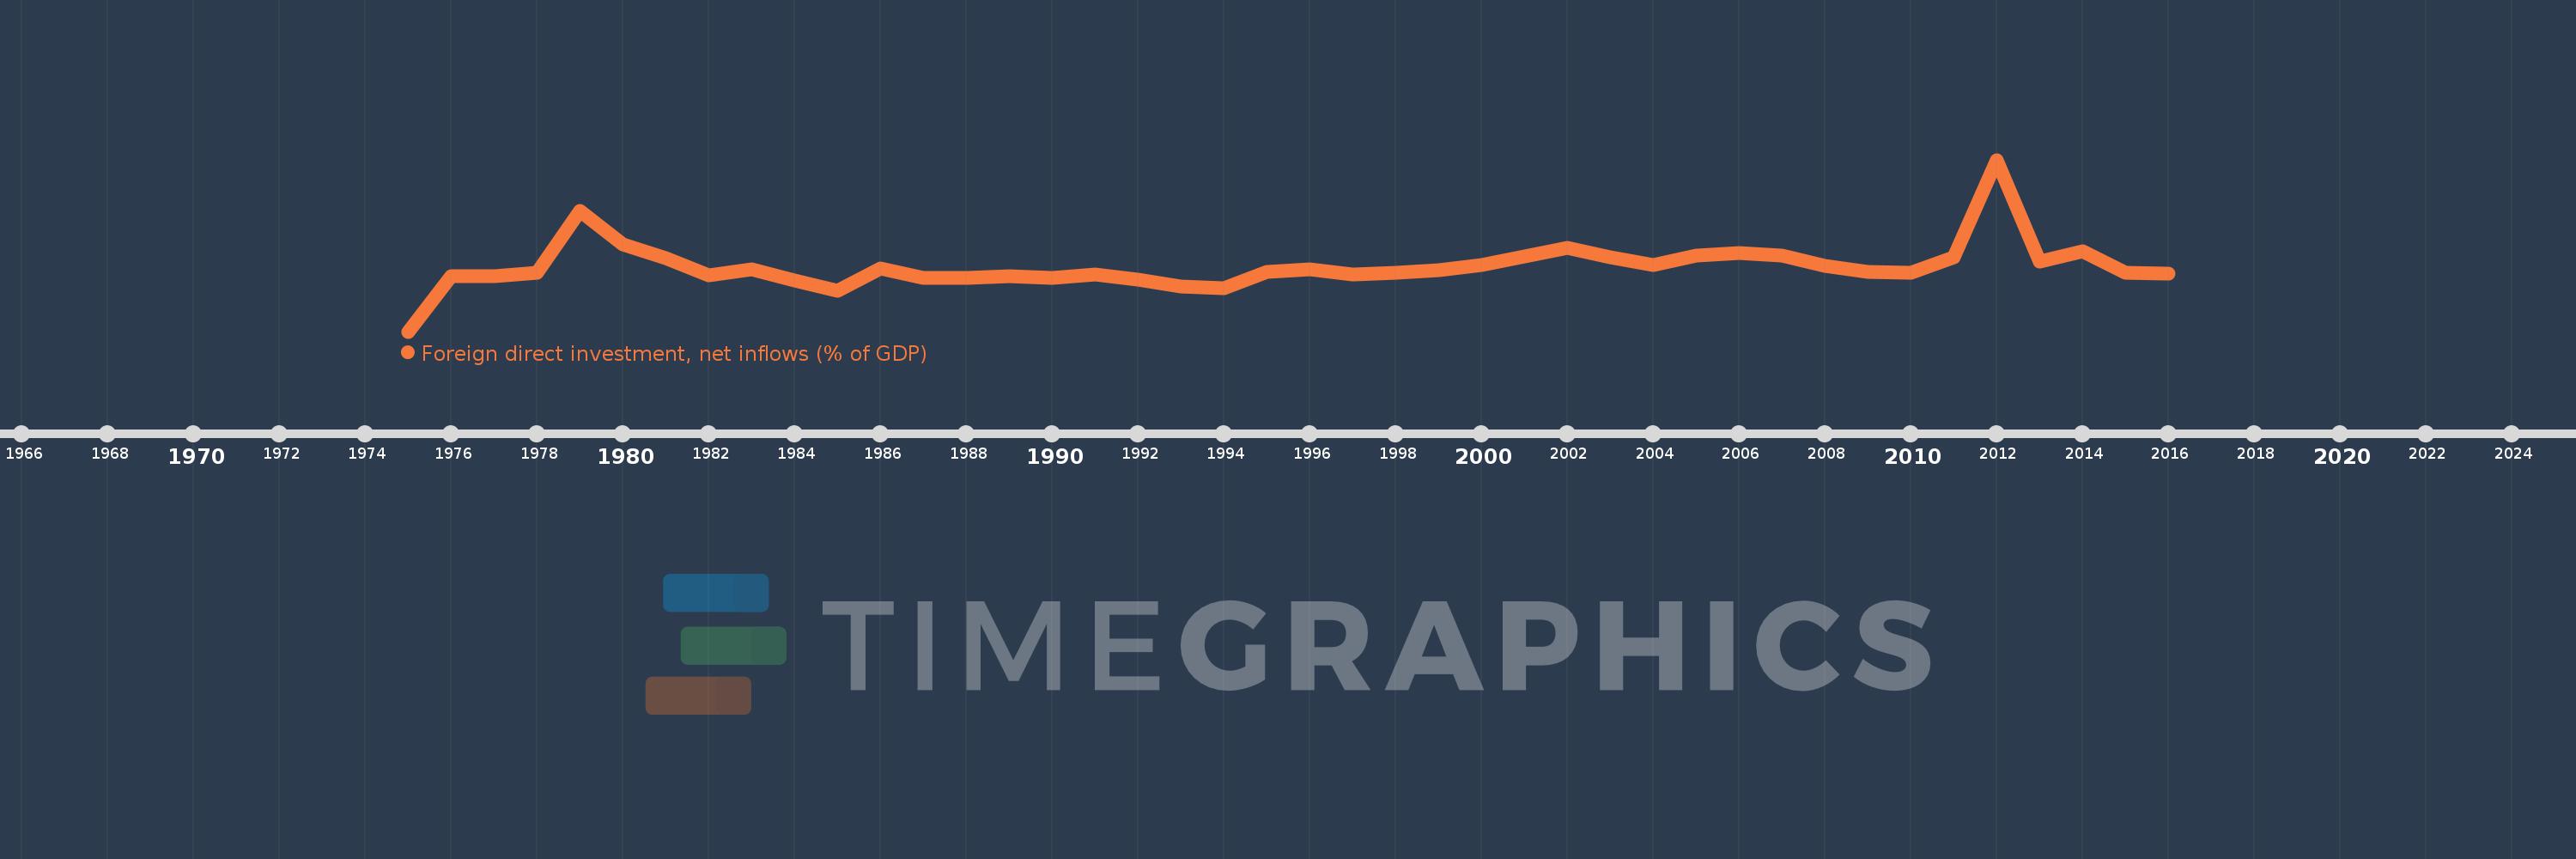
Foreign direct investment, net inflows (% of GDP)
2016,2015,2014,2013,2012,2011,2010,2009,2008,2007,2006,2005,2004,2003,2002,2001,2000,1999,1998,1997,1996,1995,1994,1993,1992,1991,1990,1989,1988,1987,1986,1985,1984,1983,1982,1981,1980,1979,1978,1977,1976,1975
Estas estatísticas em outros países:
AfghanistanAlbaniaAlgeriaAngolaAntigua and BarbudaArab WorldArgentinaArmeniaArubaAustraliaAustriaAzerbaijanBahamas, TheBahrainBangladeshBarbadosBelarusBelgiumBelizeBeninBermudaBhutanBoliviaBosnia and HerzegovinaBotswanaBrazilBrunei DarussalamBulgariaBurkina FasoBurundiCabo VerdeCambodiaCameroonCanadaCaribbean small statesCayman IslandsCentral African RepublicCentral Europe and the BalticsChadChileChinaColombiaComorosCongo, Dem. Rep.Congo, Rep.Costa RicaCote d'IvoireCroatiaCyprusCzech RepublicDenmarkDjiboutiDominicaDominican RepublicEarly-demographic dividendEast Asia & PacificEast Asia & Pacific (excluding high income)East Asia & Pacific (IDA & IBRD countries)EcuadorEgypt, Arab Rep.El SalvadorEquatorial GuineaEritreaEstoniaEthiopiaEuro areaEurope & Central AsiaEurope & Central Asia (excluding high income)Europe & Central Asia (IDA & IBRD countries)European UnionFijiFinlandFragile and conflict affected situationsFranceFrench PolynesiaGabonGambia, TheGeorgiaGermanyGhanaGreeceGrenadaGuatemalaGuineaGuinea-BissauGuyanaHaitiHeavily indebted poor countries (HIPC)High incomeHondurasHong Kong SAR, ChinaHungaryIBRD onlyIcelandIDA & IBRD totalIDA blendIDA onlyIDA totalIndiaIndonesiaIran, Islamic Rep.IraqIrelandIsraelItalyJamaicaJapanJordanKazakhstanKenyaKiribatiKorea, Rep.KosovoKuwaitKyrgyz RepublicLao PDRLate-demographic dividendLatin America & Caribbean Latin America & Caribbean (excluding high income)Latin America & the Caribbean (IDA & IBRD countries)LatviaLeast developed countries: UN classificationLebanonLesothoLiberiaLibyaLithuaniaLow & middle incomeLow incomeLower middle incomeLuxembourgMacao SAR, ChinaMacedonia, FYRMadagascarMalawiMalaysiaMaldivesMaliMaltaMarshall IslandsMauritaniaMauritiusMexicoMicronesia, Fed. Sts.Middle East & North AfricaMiddle East & North Africa (excluding high income)Middle East & North Africa (IDA & IBRD countries)Middle incomeMoldovaMongoliaMontenegroMoroccoMozambiqueMyanmarNamibiaNauruNepalNetherlandsNew CaledoniaNew ZealandNicaraguaNigerNigeriaNorth AmericaNorwayOECD membersOmanOther small statesPacific island small statesPakistanPalauPanamaPapua New GuineaParaguayPeruPhilippinesPolandPortugalPost-demographic dividendPre-demographic dividendQatarRomaniaRussian FederationRwandaSamoaSao Tome and PrincipeSaudi ArabiaSenegalSerbiaSeychellesSierra LeoneSingaporeSlovak RepublicSloveniaSmall statesSolomon IslandsSomaliaSouth AfricaSouth AsiaSouth Asia (IDA & IBRD)South SudanSpainSri LankaSt. Kitts and NevisSt. LuciaSt. Vincent and the GrenadinesSub-Saharan Africa Sub-Saharan Africa (excluding high income)Sub-Saharan Africa (IDA & IBRD countries)SudanSurinameSwazilandSwedenSwitzerlandSyrian Arab RepublicTajikistanTanzaniaThailandTimor-LesteTogoTongaTrinidad and TobagoTunisiaTurkeyTurkmenistanTuvaluUgandaUkraineUnited Arab EmiratesUnited KingdomUnited StatesUpper middle incomeUruguayUzbekistanVanuatuVenezuela, RBVietnamWest Bank and GazaWorldYemen, Rep.ZambiaZimbabwe Linha do tempo:
Nesta escala de tempo está apresentado um gráfico de 1975 ano até 2016 ano Togo. Dados de 1974 ano ausente. O número de observações reais por data: 42.
Fonte (nome):
Indicadores de desenvolvimento mundial
Fonte (organização):
International Monetary Fund, International Financial Statistics and Balance of Payments databases, World Bank, International Debt Statistics, and World Bank and OECD GDP estimates.
Categorias:
Economy & Growth, Financial Sector, Climate Change
Foi atualizado:
23 abr 2017 ano
Indicadores de alterações dos valores ao longo dos anos
Mínimo:
-7.91
1 jan 1975 ano
Máximo:
19.376
1 jan 2012 ano
Na data de observação
Valor
Mudança absoluta
A alteração em relação ao valor anterior
1 jan 1975 ano
-7.91
-7.91
0.0%
1 jan 1976 ano
0.844
+8.754
-110.67%
1 jan 1977 ano
0.908
+0.064
7.56%
1 jan 1978 ano
1.448
+0.54
59.47%
1 jan 1979 ano
11.27
+9.822
678.22%
1 jan 1980 ano
5.897
-5.373
-47.68%
1 jan 1981 ano
3.761
-2.136
-36.23%
1 jan 1982 ano
1.059
-2.701
-71.83%
1 jan 1983 ano
1.963
+0.904
85.35%
1 jan 1984 ano
0.188
-1.775
-90.4%
1 jan 1985 ano
-1.384
-1.572
-834.11%
1 jan 1986 ano
2.135
+3.519
-254.29%
1 jan 1987 ano
0.576
-1.559
-73.01%
1 jan 1988 ano
0.572
-0.004
-0.65%
1 jan 1989 ano
0.94
+0.368
64.27%
1 jan 1990 ano
0.678
-0.263
-27.93%
1 jan 1991 ano
1.12
+0.442
65.27%
1 jan 1992 ano
0.404
-0.716
-63.89%
1 jan 1993 ano
-0.774
-1.179
-291.48%
1 jan 1994 ano
-0.963
-0.188
24.3%
1 jan 1995 ano
1.569
+2.532
-263.03%
1 jan 1996 ano
1.999
+0.429
27.36%
1 jan 1997 ano
1.181
-0.817
-40.9%
1 jan 1998 ano
1.401
+0.22
18.62%
1 jan 1999 ano
1.9
+0.499
35.63%
1 jan 2000 ano
2.7
+0.8
42.1%
1 jan 2001 ano
4.071
+1.371
50.77%
1 jan 2002 ano
5.446
+1.375
33.77%
1 jan 2003 ano
3.902
-1.544
-28.35%
1 jan 2004 ano
2.729
-1.173
-30.06%
1 jan 2005 ano
4.121
+1.392
51.02%
1 jan 2006 ano
4.537
+0.416
10.1%
1 jan 2007 ano
4.145
-0.392
-8.63%
1 jan 2008 ano
2.47
-1.676
-40.42%
1 jan 2009 ano
1.602
-0.868
-35.12%
1 jan 2010 ano
1.458
-0.144
-9.0%
1 jan 2011 ano
3.938
+2.48
170.06%
1 jan 2012 ano
19.376
+15.438
392.05%
1 jan 2013 ano
3.143
-16.233
-83.78%
1 jan 2014 ano
4.797
+1.654
52.63%
1 jan 2015 ano
1.429
-3.368
-70.21%
1 jan 2016 ano
1.288
-0.141
-9.87%
Classificação de países por estatísticas atuais por anos


Comentários: