29
/pt/
pt
AIzaSyAYiBZKx7MnpbEhh9jyipgxe19OcubqV5w
April 1, 2024
150354
Honduras
HND
true
2
1
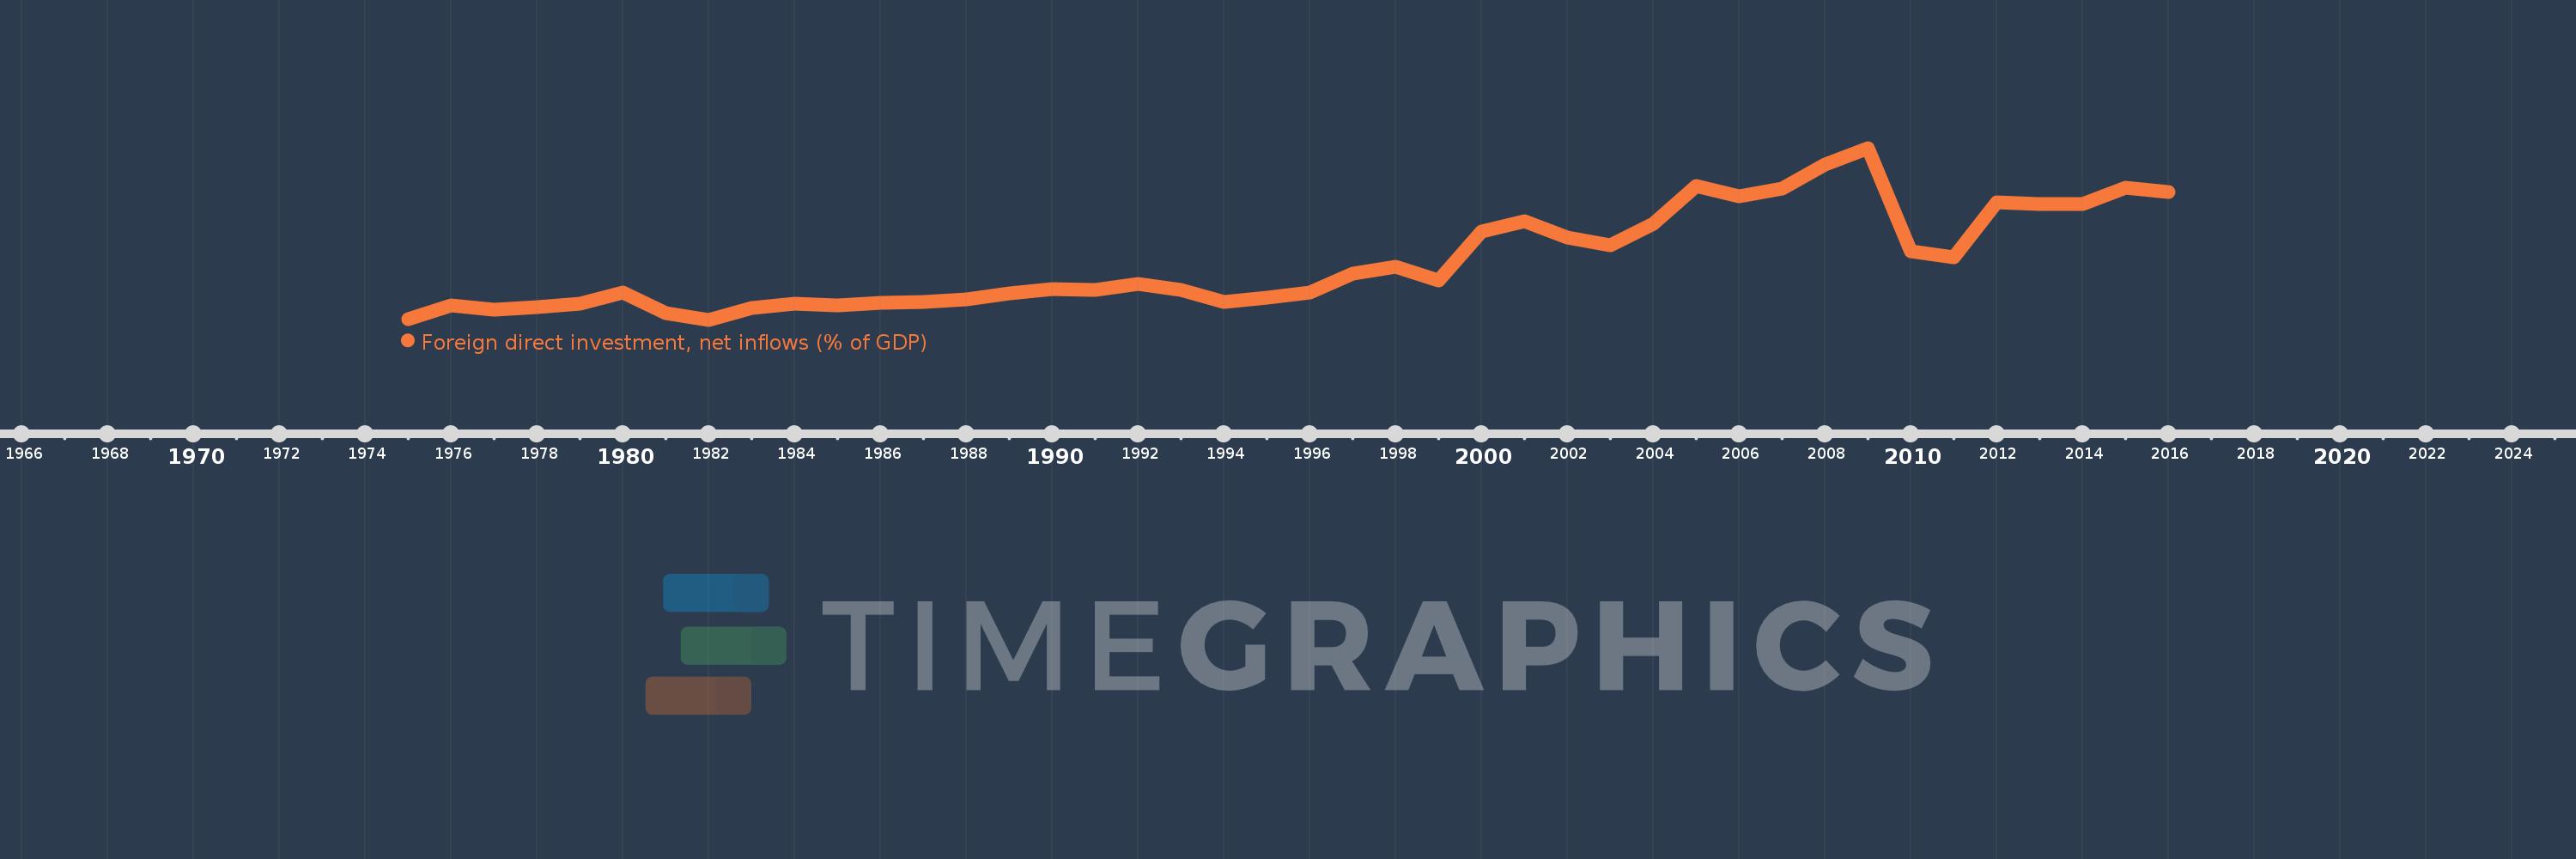
Foreign direct investment, net inflows (% of GDP)
2016,2015,2014,2013,2012,2011,2010,2009,2008,2007,2006,2005,2004,2003,2002,2001,2000,1999,1998,1997,1996,1995,1994,1993,1992,1991,1990,1989,1988,1987,1986,1985,1984,1983,1982,1981,1980,1979,1978,1977,1976,1975
Estas estatísticas em outros países:
AfghanistanAlbaniaAlgeriaAngolaAntigua and BarbudaArab WorldArgentinaArmeniaArubaAustraliaAustriaAzerbaijanBahamas, TheBahrainBangladeshBarbadosBelarusBelgiumBelizeBeninBermudaBhutanBoliviaBosnia and HerzegovinaBotswanaBrazilBrunei DarussalamBulgariaBurkina FasoBurundiCabo VerdeCambodiaCameroonCanadaCaribbean small statesCayman IslandsCentral African RepublicCentral Europe and the BalticsChadChileChinaColombiaComorosCongo, Dem. Rep.Congo, Rep.Costa RicaCote d'IvoireCroatiaCyprusCzech RepublicDenmarkDjiboutiDominicaDominican RepublicEarly-demographic dividendEast Asia & PacificEast Asia & Pacific (excluding high income)East Asia & Pacific (IDA & IBRD countries)EcuadorEgypt, Arab Rep.El SalvadorEquatorial GuineaEritreaEstoniaEthiopiaEuro areaEurope & Central AsiaEurope & Central Asia (excluding high income)Europe & Central Asia (IDA & IBRD countries)European UnionFijiFinlandFragile and conflict affected situationsFranceFrench PolynesiaGabonGambia, TheGeorgiaGermanyGhanaGreeceGrenadaGuatemalaGuineaGuinea-BissauGuyanaHaitiHeavily indebted poor countries (HIPC)High incomeHondurasHong Kong SAR, ChinaHungaryIBRD onlyIcelandIDA & IBRD totalIDA blendIDA onlyIDA totalIndiaIndonesiaIran, Islamic Rep.IraqIrelandIsraelItalyJamaicaJapanJordanKazakhstanKenyaKiribatiKorea, Rep.KosovoKuwaitKyrgyz RepublicLao PDRLate-demographic dividendLatin America & Caribbean Latin America & Caribbean (excluding high income)Latin America & the Caribbean (IDA & IBRD countries)LatviaLeast developed countries: UN classificationLebanonLesothoLiberiaLibyaLithuaniaLow & middle incomeLow incomeLower middle incomeLuxembourgMacao SAR, ChinaMacedonia, FYRMadagascarMalawiMalaysiaMaldivesMaliMaltaMarshall IslandsMauritaniaMauritiusMexicoMicronesia, Fed. Sts.Middle East & North AfricaMiddle East & North Africa (excluding high income)Middle East & North Africa (IDA & IBRD countries)Middle incomeMoldovaMongoliaMontenegroMoroccoMozambiqueMyanmarNamibiaNauruNepalNetherlandsNew CaledoniaNew ZealandNicaraguaNigerNigeriaNorth AmericaNorwayOECD membersOmanOther small statesPacific island small statesPakistanPalauPanamaPapua New GuineaParaguayPeruPhilippinesPolandPortugalPost-demographic dividendPre-demographic dividendQatarRomaniaRussian FederationRwandaSamoaSao Tome and PrincipeSaudi ArabiaSenegalSerbiaSeychellesSierra LeoneSingaporeSlovak RepublicSloveniaSmall statesSolomon IslandsSomaliaSouth AfricaSouth AsiaSouth Asia (IDA & IBRD)South SudanSpainSri LankaSt. Kitts and NevisSt. LuciaSt. Vincent and the GrenadinesSub-Saharan Africa Sub-Saharan Africa (excluding high income)Sub-Saharan Africa (IDA & IBRD countries)SudanSurinameSwazilandSwedenSwitzerlandSyrian Arab RepublicTajikistanTanzaniaThailandTimor-LesteTogoTongaTrinidad and TobagoTunisiaTurkeyTurkmenistanTuvaluUgandaUkraineUnited Arab EmiratesUnited KingdomUnited StatesUpper middle incomeUruguayUzbekistanVanuatuVenezuela, RBVietnamWest Bank and GazaWorldYemen, Rep.ZambiaZimbabwe Linha do tempo:
Nesta escala de tempo está apresentado um gráfico de 1975 ano até 2016 ano Honduras. Dados de 1974 ano ausente. O número de observações reais por data: 42.
Fonte (nome):
Indicadores de desenvolvimento mundial
Fonte (organização):
International Monetary Fund, International Financial Statistics and Balance of Payments databases, World Bank, International Debt Statistics, and World Bank and OECD GDP estimates.
Categorias:
Economy & Growth, Financial Sector, Climate Change
Foi atualizado:
23 abr 2017 ano
Indicadores de alterações dos valores ao longo dos anos
Mínimo:
-0.128
1 jan 1982 ano
Máximo:
8.708
1 jan 2009 ano
Na data de observação
Valor
Mudança absoluta
A alteração em relação ao valor anterior
1 jan 1975 ano
-0.111
-0.111
0.0%
1 jan 1976 ano
0.623
+0.734
-660.23%
1 jan 1977 ano
0.389
-0.233
-37.46%
1 jan 1978 ano
0.533
+0.144
36.88%
1 jan 1979 ano
0.682
+0.148
27.84%
1 jan 1980 ano
1.252
+0.571
83.78%
1 jan 1981 ano
0.226
-1.026
-81.95%
1 jan 1982 ano
-0.128
-0.354
-156.49%
1 jan 1983 ano
0.475
+0.603
-472.24%
1 jan 1984 ano
0.682
+0.207
43.59%
1 jan 1985 ano
0.616
-0.066
-9.72%
1 jan 1986 ano
0.756
+0.139
22.63%
1 jan 1987 ano
0.788
+0.032
4.25%
1 jan 1988 ano
0.931
+0.143
18.16%
1 jan 1989 ano
1.217
+0.286
30.7%
1 jan 1990 ano
1.431
+0.215
17.65%
1 jan 1991 ano
1.427
-0.004
-0.31%
1 jan 1992 ano
1.698
+0.271
19.01%
1 jan 1993 ano
1.392
-0.306
-18.02%
1 jan 1994 ano
0.767
-0.625
-44.91%
1 jan 1995 ano
1.014
+0.247
32.22%
1 jan 1996 ano
1.278
+0.265
26.09%
1 jan 1997 ano
2.253
+0.975
76.26%
1 jan 1998 ano
2.606
+0.352
15.63%
1 jan 1999 ano
1.903
-0.702
-26.96%
1 jan 2000 ano
4.417
+2.514
132.1%
1 jan 2001 ano
4.927
+0.51
11.54%
1 jan 2002 ano
4.095
-0.832
-16.88%
1 jan 2003 ano
3.695
-0.4
-9.76%
1 jan 2004 ano
4.793
+1.098
29.71%
1 jan 2005 ano
6.752
+1.959
40.88%
1 jan 2006 ano
6.214
-0.538
-7.97%
1 jan 2007 ano
6.619
+0.404
6.51%
1 jan 2008 ano
7.877
+1.258
19.01%
1 jan 2009 ano
8.708
+0.831
10.55%
1 jan 2010 ano
3.414
-5.294
-60.8%
1 jan 2011 ano
3.082
-0.331
-9.7%
1 jan 2012 ano
5.928
+2.845
92.31%
1 jan 2013 ano
5.802
-0.126
-2.13%
1 jan 2014 ano
5.819
+0.017
0.29%
1 jan 2015 ano
6.677
+0.858
14.75%
1 jan 2016 ano
6.448
-0.229
-3.43%
Classificação de países por estatísticas atuais por anos


Comentários: