29
/pt/
pt
AIzaSyAYiBZKx7MnpbEhh9jyipgxe19OcubqV5w
April 1, 2024
286697
Zambia
ZMB
true
2
1
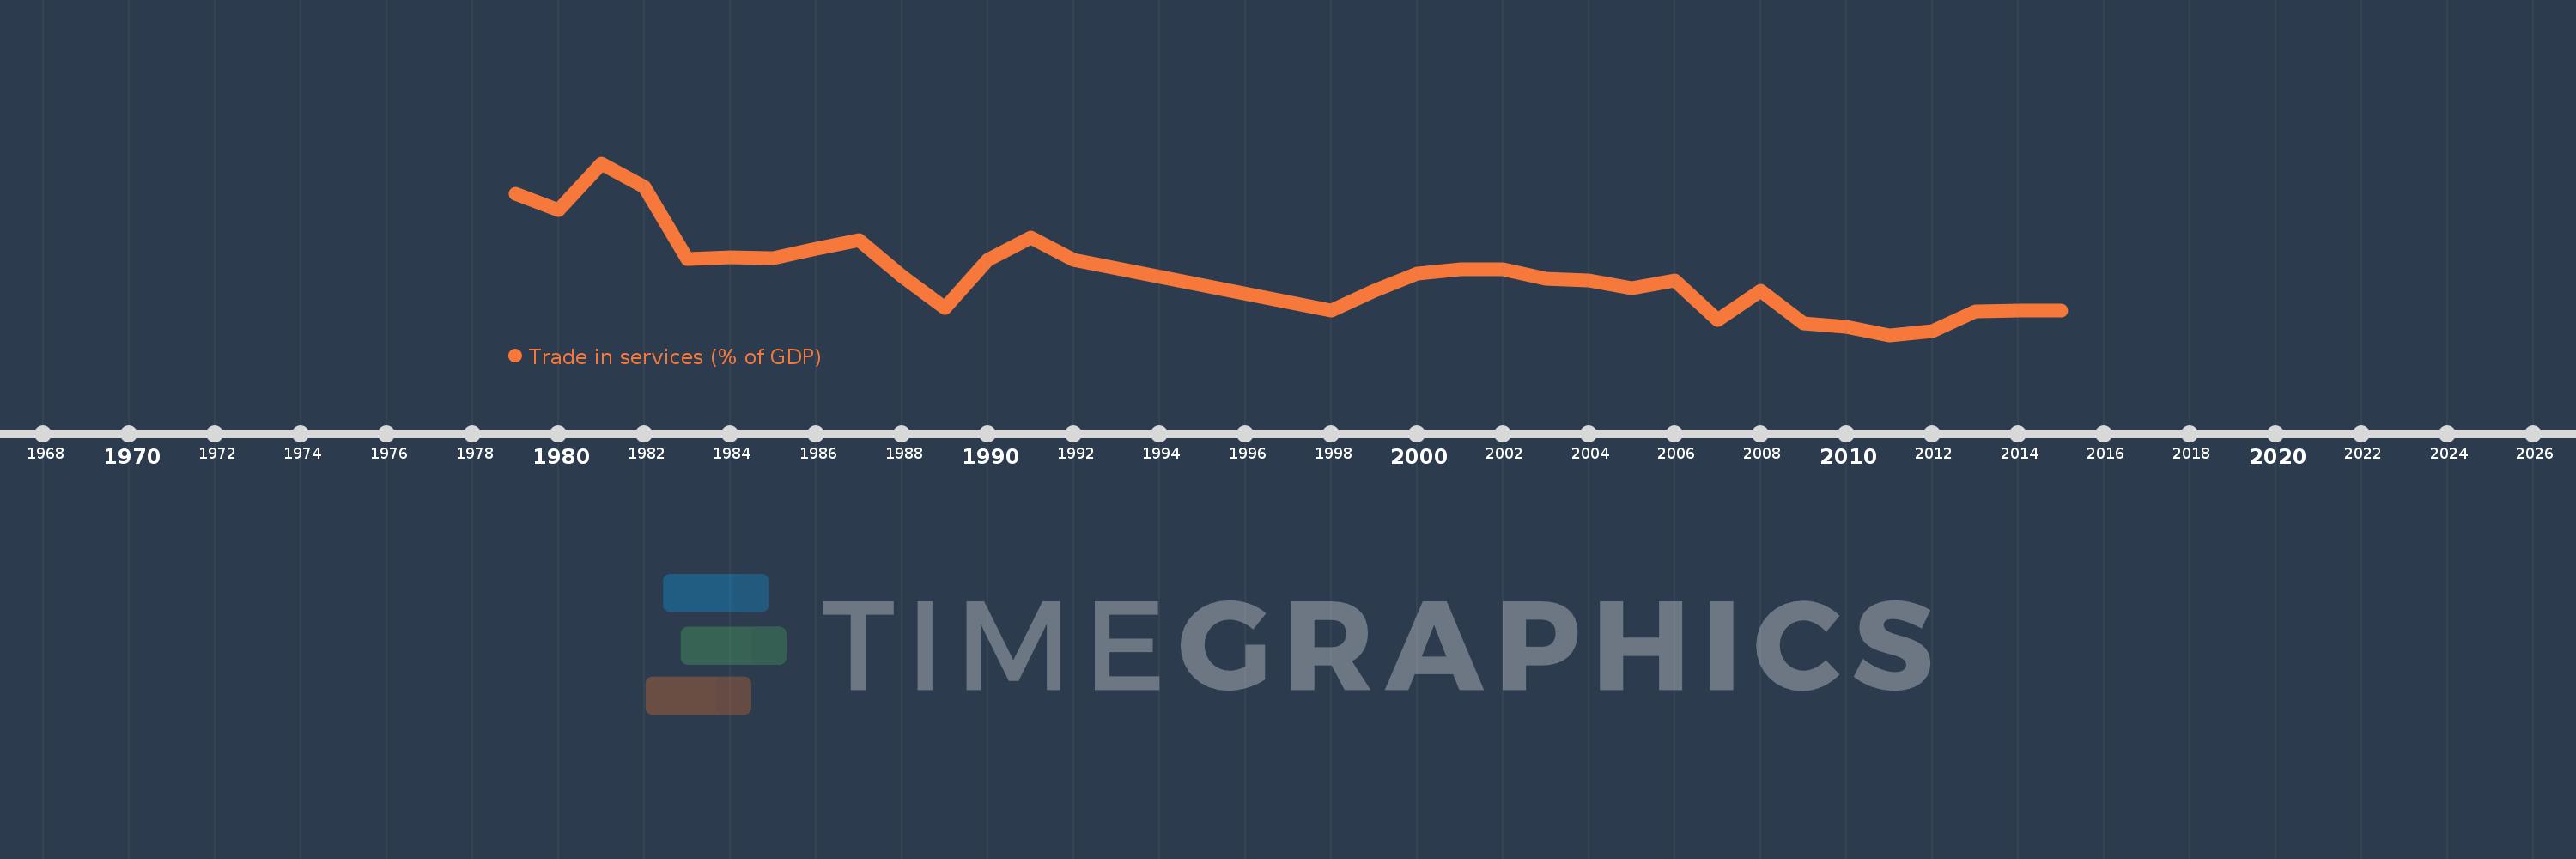
Trade in services (% of GDP)
2015,2014,2013,2012,2011,2010,2009,2008,2007,2006,2005,2004,2003,2002,2001,2000,1999,1998,1992,1991,1990,1989,1988,1987,1986,1985,1984,1983,1982,1981,1980,1979
Estas estatísticas em outros países:
AfghanistanAlbaniaAlgeriaAngolaAntigua and BarbudaArab WorldArgentinaArmeniaArubaAustraliaAustriaAzerbaijanBahamas, TheBahrainBangladeshBarbadosBelarusBelgiumBelizeBeninBermudaBhutanBoliviaBosnia and HerzegovinaBotswanaBrazilBrunei DarussalamBulgariaBurkina FasoBurundiCabo VerdeCambodiaCameroonCanadaCaribbean small statesCentral African RepublicCentral Europe and the BalticsChadChileChinaColombiaComorosCongo, Dem. Rep.Congo, Rep.Costa RicaCote d'IvoireCroatiaCyprusCzech RepublicDenmarkDjiboutiDominicaDominican RepublicEarly-demographic dividendEast Asia & PacificEast Asia & Pacific (excluding high income)East Asia & Pacific (IDA & IBRD countries)EcuadorEgypt, Arab Rep.El SalvadorEquatorial GuineaEritreaEstoniaEthiopiaEuro areaEurope & Central AsiaEurope & Central Asia (excluding high income)Europe & Central Asia (IDA & IBRD countries)European UnionFaroe IslandsFijiFinlandFragile and conflict affected situationsFranceGabonGambia, TheGeorgiaGermanyGhanaGreeceGrenadaGuatemalaGuineaGuinea-BissauGuyanaHaitiHeavily indebted poor countries (HIPC)High incomeHondurasHong Kong SAR, ChinaHungaryIBRD onlyIcelandIDA & IBRD totalIDA blendIDA onlyIDA totalIndiaIndonesiaIran, Islamic Rep.IraqIrelandIsraelItalyJamaicaJapanJordanKazakhstanKenyaKiribatiKorea, Rep.KosovoKuwaitKyrgyz RepublicLao PDRLate-demographic dividendLatin America & Caribbean Latin America & Caribbean (excluding high income)Latin America & the Caribbean (IDA & IBRD countries)LatviaLeast developed countries: UN classificationLebanonLesothoLiberiaLibyaLithuaniaLow & middle incomeLow incomeLower middle incomeLuxembourgMacao SAR, ChinaMacedonia, FYRMadagascarMalawiMalaysiaMaldivesMaliMaltaMarshall IslandsMauritaniaMauritiusMexicoMicronesia, Fed. Sts.Middle East & North AfricaMiddle East & North Africa (excluding high income)Middle East & North Africa (IDA & IBRD countries)Middle incomeMoldovaMongoliaMontenegroMoroccoMozambiqueMyanmarNamibiaNepalNetherlandsNew ZealandNicaraguaNigerNigeriaNorth AmericaNorwayOECD membersOmanOther small statesPacific island small statesPakistanPalauPanamaPapua New GuineaParaguayPeruPhilippinesPolandPortugalPost-demographic dividendPre-demographic dividendQatarRomaniaRussian FederationRwandaSamoaSao Tome and PrincipeSaudi ArabiaSenegalSerbiaSeychellesSierra LeoneSingaporeSlovak RepublicSloveniaSmall statesSolomon IslandsSouth AfricaSouth AsiaSouth Asia (IDA & IBRD)South SudanSpainSri LankaSt. Kitts and NevisSt. LuciaSt. Vincent and the GrenadinesSub-Saharan Africa Sub-Saharan Africa (excluding high income)Sub-Saharan Africa (IDA & IBRD countries)SudanSurinameSwazilandSwedenSwitzerlandSyrian Arab RepublicTajikistanTanzaniaThailandTimor-LesteTogoTongaTrinidad and TobagoTunisiaTurkeyTuvaluUgandaUkraineUnited KingdomUnited StatesUpper middle incomeUruguayVanuatuVenezuela, RBVietnamWest Bank and GazaWorldYemen, Rep.ZambiaZimbabwe Linha do tempo:
Nesta escala de tempo está apresentado um gráfico de 1979 ano até 2015 ano Zambia. Dados de 1978 ano ausente. O número de observações reais por data: 32.
Fonte (nome):
Indicadores de desenvolvimento mundial
Fonte (organização):
International Monetary Fund, Balance of Payments Statistics Yearbook and data files, and World Bank and OECD GDP estimates.
Categorias:
Economy & Growth, Private Sector, Trade
Foi atualizado:
23 abr 2017 ano
Indicadores de alterações dos valores ao longo dos anos
Mínimo:
7.199
1 jan 2011 ano
Máximo:
20.956
1 jan 1981 ano
Na data de observação
Valor
Mudança absoluta
A alteração em relação ao valor anterior
1 jan 1979 ano
18.494
+18.494
0.0%
1 jan 1980 ano
17.185
-1.308
-7.07%
1 jan 1981 ano
20.956
+3.77
21.94%
1 jan 1982 ano
19.039
-1.917
-9.15%
1 jan 1983 ano
13.275
-5.764
-30.27%
1 jan 1984 ano
13.45
+0.175
1.32%
1 jan 1985 ano
13.36
-0.09
-0.67%
1 jan 1986 ano
14.141
+0.781
5.85%
1 jan 1987 ano
14.79
+0.649
4.59%
1 jan 1988 ano
11.926
-2.864
-19.37%
1 jan 1989 ano
9.349
-2.576
-21.6%
1 jan 1990 ano
13.235
+3.885
41.55%
1 jan 1991 ano
15.004
+1.769
13.37%
1 jan 1992 ano
13.191
-1.813
-12.08%
1 jan 1998 ano
9.147
-4.044
-30.66%
1 jan 1999 ano
10.753
+1.606
17.56%
1 jan 2000 ano
12.114
+1.361
12.66%
1 jan 2001 ano
12.488
+0.373
3.08%
1 jan 2002 ano
12.472
-0.015
-0.12%
1 jan 2003 ano
11.687
-0.785
-6.3%
1 jan 2004 ano
11.596
-0.091
-0.78%
1 jan 2005 ano
10.916
-0.68
-5.86%
1 jan 2006 ano
11.543
+0.626
5.74%
1 jan 2007 ano
8.437
-3.105
-26.9%
1 jan 2008 ano
10.717
+2.28
27.02%
1 jan 2009 ano
8.114
-2.603
-24.29%
1 jan 2010 ano
7.831
-0.283
-3.49%
1 jan 2011 ano
7.199
-0.631
-8.06%
1 jan 2012 ano
7.495
+0.296
4.11%
1 jan 2013 ano
9.113
+1.617
21.58%
1 jan 2014 ano
9.179
+0.066
0.73%
1 jan 2015 ano
9.19
+0.012
0.13%
Classificação de países por estatísticas atuais por anos


Comentários: