29
/pt/
pt
AIzaSyAYiBZKx7MnpbEhh9jyipgxe19OcubqV5w
April 1, 2024
226497
Portugal
PRT
true
2
1
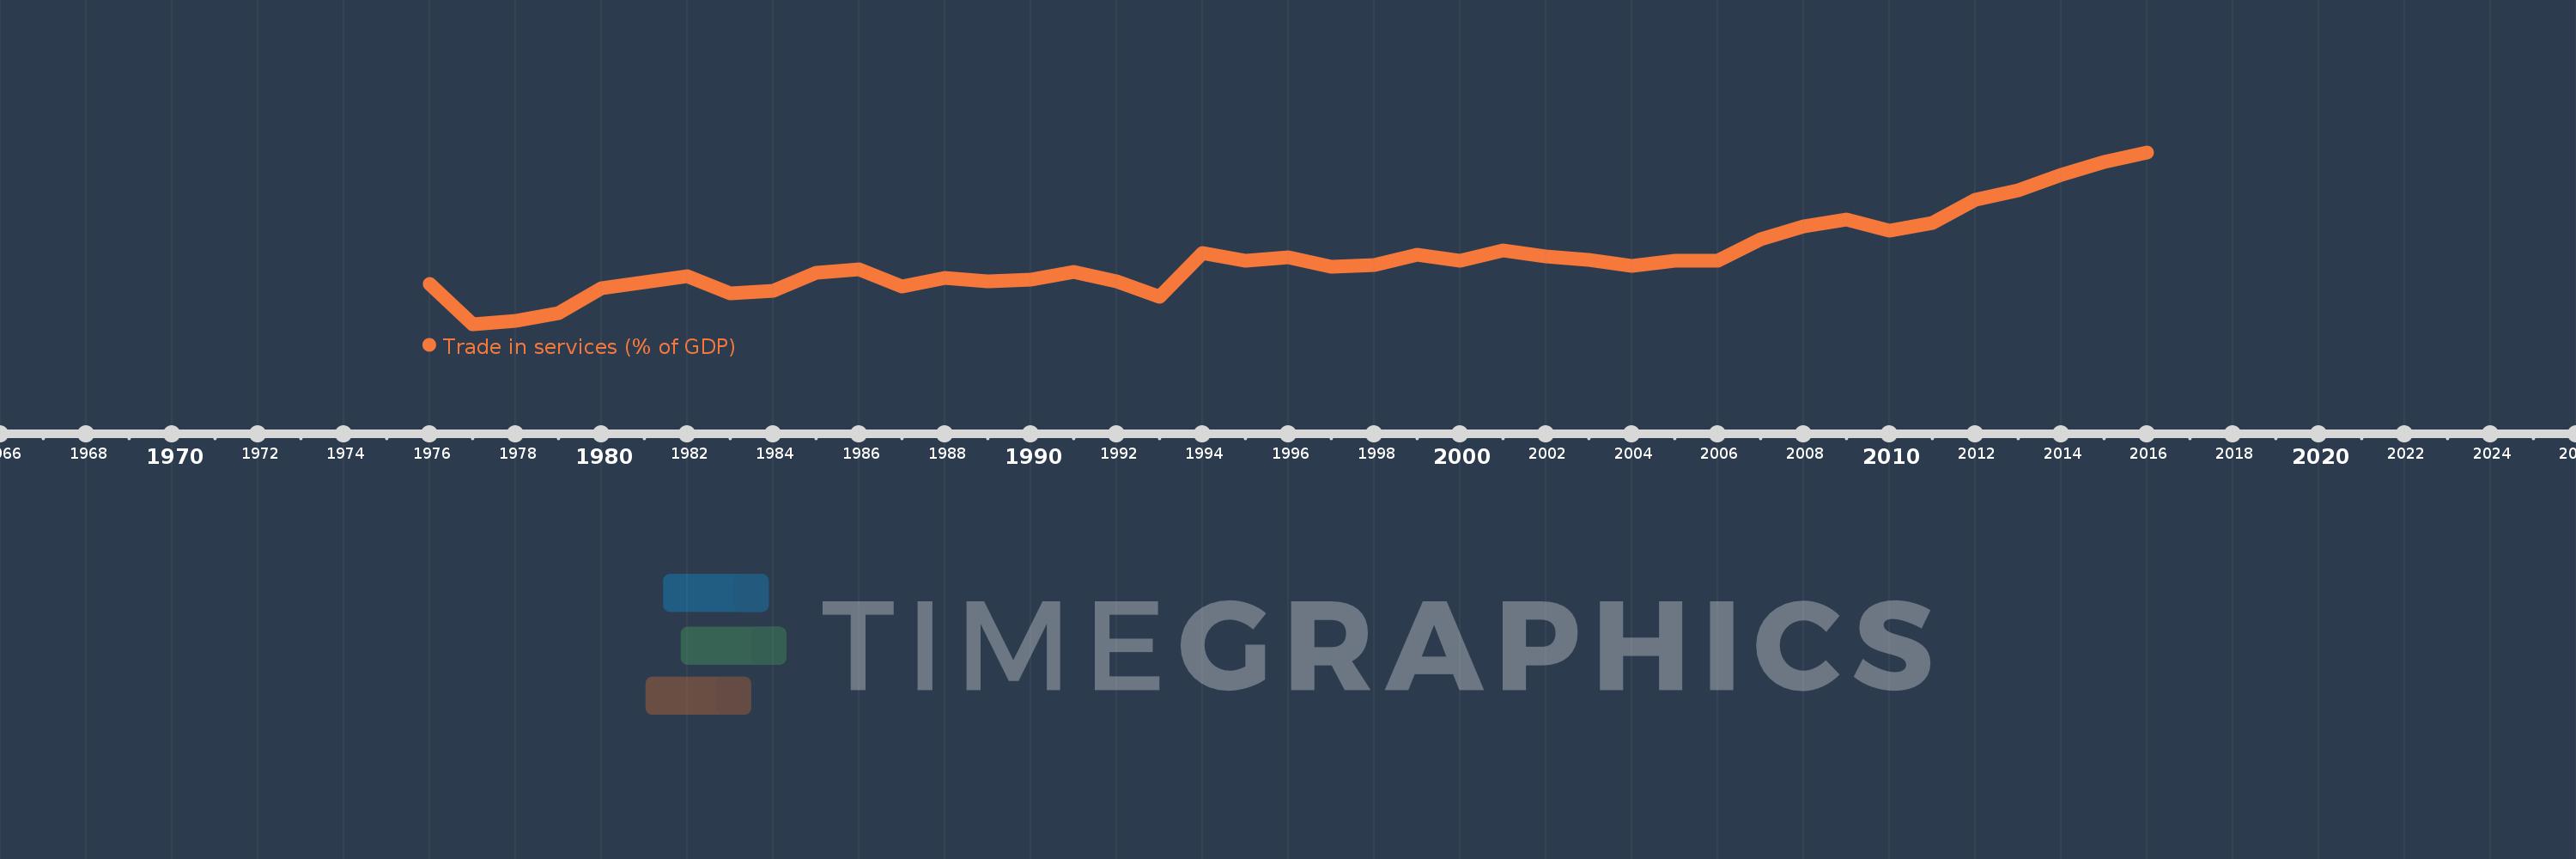
Trade in services (% of GDP)
2016,2015,2014,2013,2012,2011,2010,2009,2008,2007,2006,2005,2004,2003,2002,2001,2000,1999,1998,1997,1996,1995,1994,1993,1992,1991,1990,1989,1988,1987,1986,1985,1984,1983,1982,1981,1980,1979,1978,1977,1976
Estas estatísticas em outros países:
AfghanistanAlbaniaAlgeriaAngolaAntigua and BarbudaArab WorldArgentinaArmeniaArubaAustraliaAustriaAzerbaijanBahamas, TheBahrainBangladeshBarbadosBelarusBelgiumBelizeBeninBermudaBhutanBoliviaBosnia and HerzegovinaBotswanaBrazilBrunei DarussalamBulgariaBurkina FasoBurundiCabo VerdeCambodiaCameroonCanadaCaribbean small statesCentral African RepublicCentral Europe and the BalticsChadChileChinaColombiaComorosCongo, Dem. Rep.Congo, Rep.Costa RicaCote d'IvoireCroatiaCyprusCzech RepublicDenmarkDjiboutiDominicaDominican RepublicEarly-demographic dividendEast Asia & PacificEast Asia & Pacific (excluding high income)East Asia & Pacific (IDA & IBRD countries)EcuadorEgypt, Arab Rep.El SalvadorEquatorial GuineaEritreaEstoniaEthiopiaEuro areaEurope & Central AsiaEurope & Central Asia (excluding high income)Europe & Central Asia (IDA & IBRD countries)European UnionFaroe IslandsFijiFinlandFragile and conflict affected situationsFranceGabonGambia, TheGeorgiaGermanyGhanaGreeceGrenadaGuatemalaGuineaGuinea-BissauGuyanaHaitiHeavily indebted poor countries (HIPC)High incomeHondurasHong Kong SAR, ChinaHungaryIBRD onlyIcelandIDA & IBRD totalIDA blendIDA onlyIDA totalIndiaIndonesiaIran, Islamic Rep.IraqIrelandIsraelItalyJamaicaJapanJordanKazakhstanKenyaKiribatiKorea, Rep.KosovoKuwaitKyrgyz RepublicLao PDRLate-demographic dividendLatin America & Caribbean Latin America & Caribbean (excluding high income)Latin America & the Caribbean (IDA & IBRD countries)LatviaLeast developed countries: UN classificationLebanonLesothoLiberiaLibyaLithuaniaLow & middle incomeLow incomeLower middle incomeLuxembourgMacao SAR, ChinaMacedonia, FYRMadagascarMalawiMalaysiaMaldivesMaliMaltaMarshall IslandsMauritaniaMauritiusMexicoMicronesia, Fed. Sts.Middle East & North AfricaMiddle East & North Africa (excluding high income)Middle East & North Africa (IDA & IBRD countries)Middle incomeMoldovaMongoliaMontenegroMoroccoMozambiqueMyanmarNamibiaNepalNetherlandsNew ZealandNicaraguaNigerNigeriaNorth AmericaNorwayOECD membersOmanOther small statesPacific island small statesPakistanPalauPanamaPapua New GuineaParaguayPeruPhilippinesPolandPortugalPost-demographic dividendPre-demographic dividendQatarRomaniaRussian FederationRwandaSamoaSao Tome and PrincipeSaudi ArabiaSenegalSerbiaSeychellesSierra LeoneSingaporeSlovak RepublicSloveniaSmall statesSolomon IslandsSouth AfricaSouth AsiaSouth Asia (IDA & IBRD)South SudanSpainSri LankaSt. Kitts and NevisSt. LuciaSt. Vincent and the GrenadinesSub-Saharan Africa Sub-Saharan Africa (excluding high income)Sub-Saharan Africa (IDA & IBRD countries)SudanSurinameSwazilandSwedenSwitzerlandSyrian Arab RepublicTajikistanTanzaniaThailandTimor-LesteTogoTongaTrinidad and TobagoTunisiaTurkeyTuvaluUgandaUkraineUnited KingdomUnited StatesUpper middle incomeUruguayVanuatuVenezuela, RBVietnamWest Bank and GazaWorldYemen, Rep.ZambiaZimbabwe Linha do tempo:
Nesta escala de tempo está apresentado um gráfico de 1976 ano até 2016 ano Portugal. Dados de 1975 ano ausente. O número de observações reais por data: 41.
Fonte (nome):
Indicadores de desenvolvimento mundial
Fonte (organização):
International Monetary Fund, Balance of Payments Statistics Yearbook and data files, and World Bank and OECD GDP estimates.
Categorias:
Economy & Growth, Private Sector, Trade
Foi atualizado:
23 abr 2017 ano
Indicadores de alterações dos valores ao longo dos anos
Mínimo:
7.311
1 jan 1977 ano
Máximo:
21.258
1 jan 2016 ano
Na data de observação
Valor
Mudança absoluta
A alteração em relação ao valor anterior
1 jan 1976 ano
10.599
+10.599
0.0%
1 jan 1977 ano
7.311
-3.288
-31.02%
1 jan 1978 ano
7.578
+0.266
3.64%
1 jan 1979 ano
8.192
+0.615
8.11%
1 jan 1980 ano
10.214
+2.021
24.67%
1 jan 1981 ano
10.731
+0.517
5.06%
1 jan 1982 ano
11.209
+0.479
4.46%
1 jan 1983 ano
9.819
-1.391
-12.41%
1 jan 1984 ano
10.028
+0.209
2.13%
1 jan 1985 ano
11.497
+1.469
14.65%
1 jan 1986 ano
11.798
+0.301
2.62%
1 jan 1987 ano
10.348
-1.45
-12.29%
1 jan 1988 ano
11.042
+0.694
6.71%
1 jan 1989 ano
10.801
-0.242
-2.19%
1 jan 1990 ano
10.923
+0.122
1.13%
1 jan 1991 ano
11.56
+0.638
5.84%
1 jan 1992 ano
10.814
-0.746
-6.46%
1 jan 1993 ano
9.506
-1.308
-12.09%
1 jan 1994 ano
13.122
+3.616
38.03%
1 jan 1995 ano
12.459
-0.663
-5.05%
1 jan 1996 ano
12.71
+0.251
2.02%
1 jan 1997 ano
11.98
-0.73
-5.74%
1 jan 1998 ano
12.103
+0.122
1.02%
1 jan 1999 ano
12.965
+0.862
7.13%
1 jan 2000 ano
12.474
-0.491
-3.78%
1 jan 2001 ano
13.3
+0.826
6.62%
1 jan 2002 ano
12.802
-0.498
-3.74%
1 jan 2003 ano
12.543
-0.259
-2.02%
1 jan 2004 ano
12.072
-0.471
-3.76%
1 jan 2005 ano
12.496
+0.424
3.51%
1 jan 2006 ano
12.462
-0.033
-0.27%
1 jan 2007 ano
14.189
+1.726
13.85%
1 jan 2008 ano
15.266
+1.078
7.6%
1 jan 2009 ano
15.821
+0.555
3.63%
1 jan 2010 ano
14.911
-0.909
-5.75%
1 jan 2011 ano
15.526
+0.614
4.12%
1 jan 2012 ano
17.402
+1.876
12.08%
1 jan 2013 ano
18.162
+0.76
4.37%
1 jan 2014 ano
19.412
+1.25
6.88%
1 jan 2015 ano
20.515
+1.103
5.68%
1 jan 2016 ano
21.258
+0.743
3.62%
Classificação de países por estatísticas atuais por anos


Comentários: