29
/pt/
pt
AIzaSyAYiBZKx7MnpbEhh9jyipgxe19OcubqV5w
April 1, 2024
238831
Seychelles
SYC
true
2
1
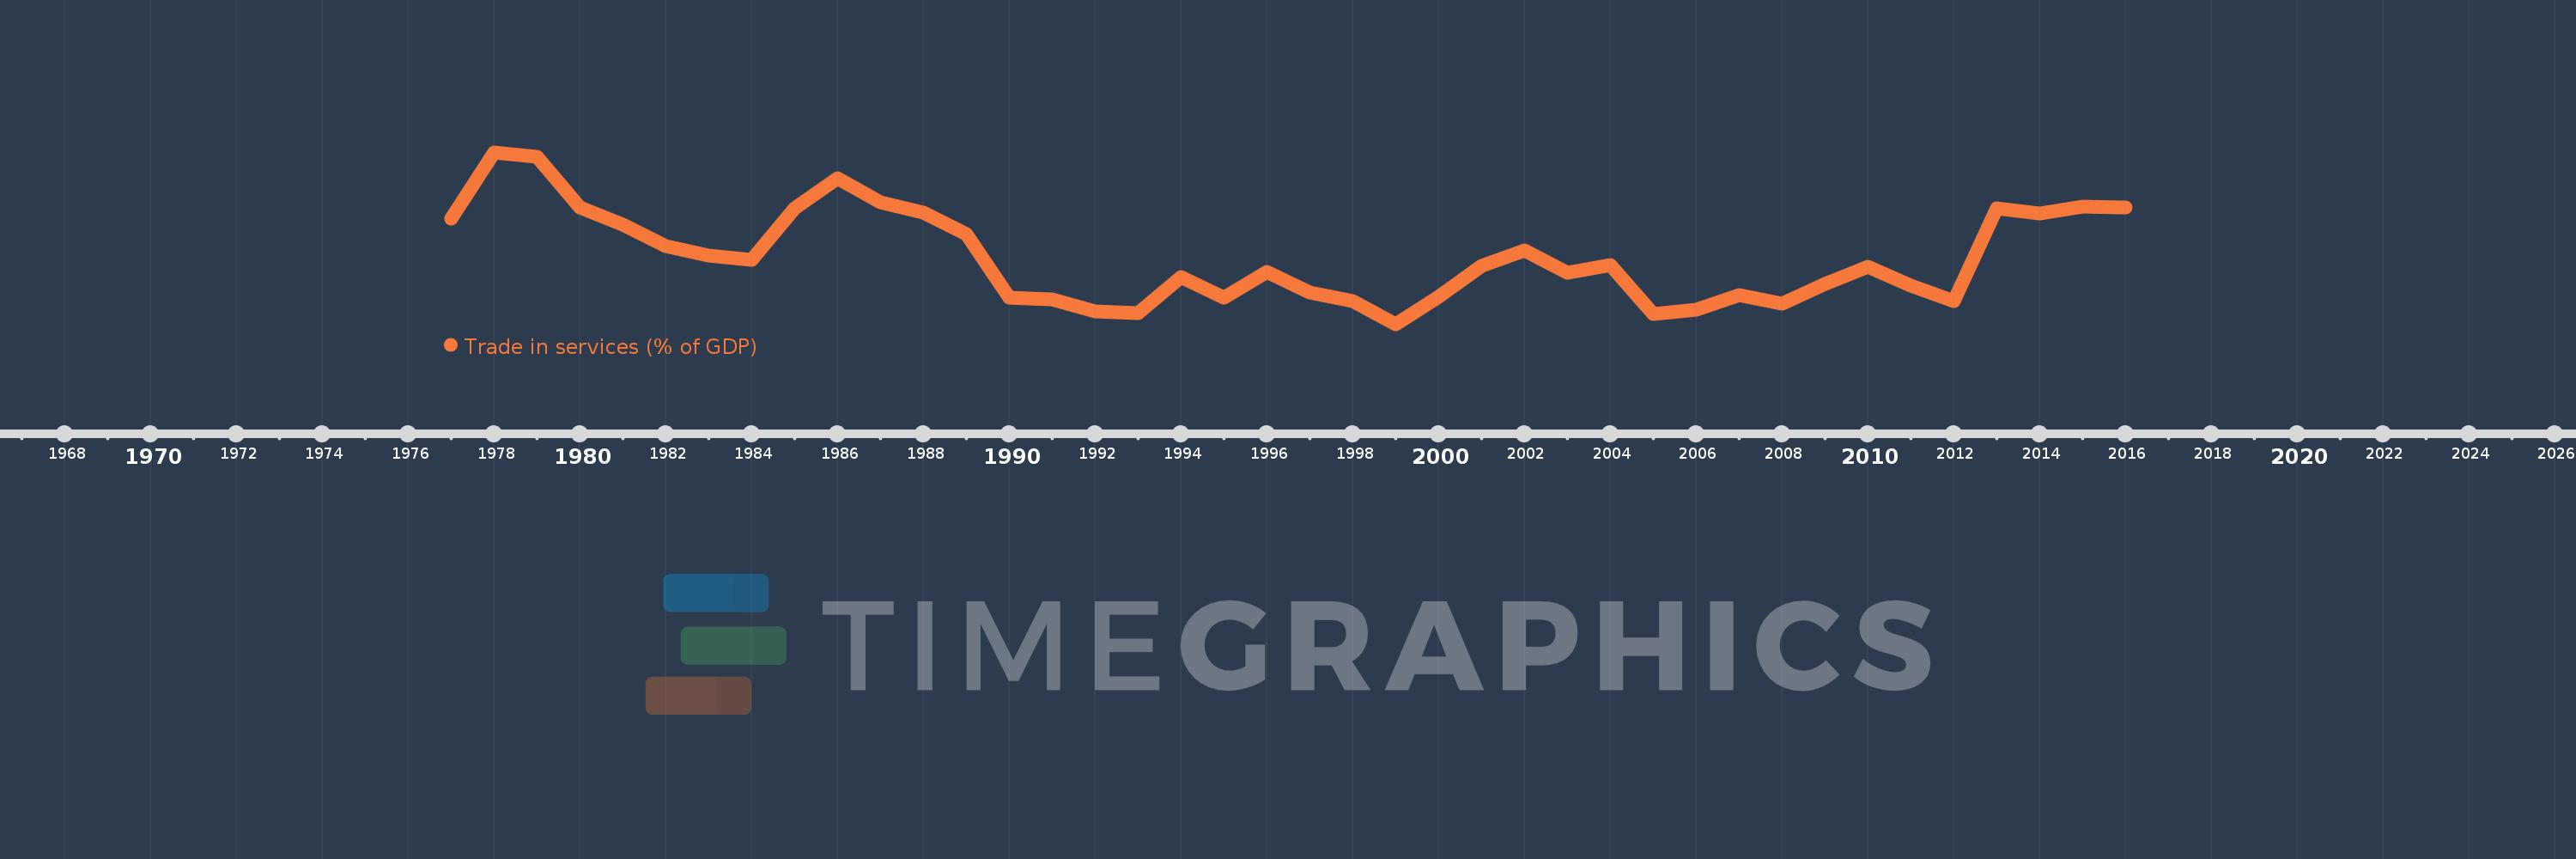
Trade in services (% of GDP)
2016,2015,2014,2013,2012,2011,2010,2009,2008,2007,2006,2005,2004,2003,2002,2001,2000,1999,1998,1997,1996,1995,1994,1993,1992,1991,1990,1989,1988,1987,1986,1985,1984,1983,1982,1981,1980,1979,1978,1977
Estas estatísticas em outros países:
AfghanistanAlbaniaAlgeriaAngolaAntigua and BarbudaArab WorldArgentinaArmeniaArubaAustraliaAustriaAzerbaijanBahamas, TheBahrainBangladeshBarbadosBelarusBelgiumBelizeBeninBermudaBhutanBoliviaBosnia and HerzegovinaBotswanaBrazilBrunei DarussalamBulgariaBurkina FasoBurundiCabo VerdeCambodiaCameroonCanadaCaribbean small statesCentral African RepublicCentral Europe and the BalticsChadChileChinaColombiaComorosCongo, Dem. Rep.Congo, Rep.Costa RicaCote d'IvoireCroatiaCyprusCzech RepublicDenmarkDjiboutiDominicaDominican RepublicEarly-demographic dividendEast Asia & PacificEast Asia & Pacific (excluding high income)East Asia & Pacific (IDA & IBRD countries)EcuadorEgypt, Arab Rep.El SalvadorEquatorial GuineaEritreaEstoniaEthiopiaEuro areaEurope & Central AsiaEurope & Central Asia (excluding high income)Europe & Central Asia (IDA & IBRD countries)European UnionFaroe IslandsFijiFinlandFragile and conflict affected situationsFranceGabonGambia, TheGeorgiaGermanyGhanaGreeceGrenadaGuatemalaGuineaGuinea-BissauGuyanaHaitiHeavily indebted poor countries (HIPC)High incomeHondurasHong Kong SAR, ChinaHungaryIBRD onlyIcelandIDA & IBRD totalIDA blendIDA onlyIDA totalIndiaIndonesiaIran, Islamic Rep.IraqIrelandIsraelItalyJamaicaJapanJordanKazakhstanKenyaKiribatiKorea, Rep.KosovoKuwaitKyrgyz RepublicLao PDRLate-demographic dividendLatin America & Caribbean Latin America & Caribbean (excluding high income)Latin America & the Caribbean (IDA & IBRD countries)LatviaLeast developed countries: UN classificationLebanonLesothoLiberiaLibyaLithuaniaLow & middle incomeLow incomeLower middle incomeLuxembourgMacao SAR, ChinaMacedonia, FYRMadagascarMalawiMalaysiaMaldivesMaliMaltaMarshall IslandsMauritaniaMauritiusMexicoMicronesia, Fed. Sts.Middle East & North AfricaMiddle East & North Africa (excluding high income)Middle East & North Africa (IDA & IBRD countries)Middle incomeMoldovaMongoliaMontenegroMoroccoMozambiqueMyanmarNamibiaNepalNetherlandsNew ZealandNicaraguaNigerNigeriaNorth AmericaNorwayOECD membersOmanOther small statesPacific island small statesPakistanPalauPanamaPapua New GuineaParaguayPeruPhilippinesPolandPortugalPost-demographic dividendPre-demographic dividendQatarRomaniaRussian FederationRwandaSamoaSao Tome and PrincipeSaudi ArabiaSenegalSerbiaSeychellesSierra LeoneSingaporeSlovak RepublicSloveniaSmall statesSolomon IslandsSouth AfricaSouth AsiaSouth Asia (IDA & IBRD)South SudanSpainSri LankaSt. Kitts and NevisSt. LuciaSt. Vincent and the GrenadinesSub-Saharan Africa Sub-Saharan Africa (excluding high income)Sub-Saharan Africa (IDA & IBRD countries)SudanSurinameSwazilandSwedenSwitzerlandSyrian Arab RepublicTajikistanTanzaniaThailandTimor-LesteTogoTongaTrinidad and TobagoTunisiaTurkeyTuvaluUgandaUkraineUnited KingdomUnited StatesUpper middle incomeUruguayVanuatuVenezuela, RBVietnamWest Bank and GazaWorldYemen, Rep.ZambiaZimbabwe Linha do tempo:
Nesta escala de tempo está apresentado um gráfico de 1977 ano até 2016 ano Seychelles. Dados de 1976 ano ausente. O número de observações reais por data: 40.
Fonte (nome):
Indicadores de desenvolvimento mundial
Fonte (organização):
International Monetary Fund, Balance of Payments Statistics Yearbook and data files, and World Bank and OECD GDP estimates.
Categorias:
Economy & Growth, Private Sector, Trade
Foi atualizado:
23 abr 2017 ano
Indicadores de alterações dos valores ao longo dos anos
Mínimo:
62.492
1 jan 1999 ano
Máximo:
108.414
1 jan 1978 ano
Na data de observação
Valor
Mudança absoluta
A alteração em relação ao valor anterior
1 jan 1977 ano
90.674
+90.674
0.0%
1 jan 1978 ano
108.414
+17.74
19.56%
1 jan 1979 ano
107.162
-1.252
-1.16%
1 jan 1980 ano
93.792
-13.37
-12.48%
1 jan 1981 ano
89.119
-4.673
-4.98%
1 jan 1982 ano
83.399
-5.719
-6.42%
1 jan 1983 ano
80.856
-2.544
-3.05%
1 jan 1984 ano
79.663
-1.193
-1.48%
1 jan 1985 ano
93.465
+13.802
17.33%
1 jan 1986 ano
101.408
+7.942
8.5%
1 jan 1987 ano
95.165
-6.243
-6.16%
1 jan 1988 ano
92.235
-2.93
-3.08%
1 jan 1989 ano
86.685
-5.55
-6.02%
1 jan 1990 ano
69.629
-17.056
-19.68%
1 jan 1991 ano
69.174
-0.455
-0.65%
1 jan 1992 ano
66.006
-3.168
-4.58%
1 jan 1993 ano
65.546
-0.46
-0.7%
1 jan 1994 ano
75.146
+9.6
14.65%
1 jan 1995 ano
69.533
-5.613
-7.47%
1 jan 1996 ano
76.457
+6.924
9.96%
1 jan 1997 ano
71.036
-5.42
-7.09%
1 jan 1998 ano
68.576
-2.46
-3.46%
1 jan 1999 ano
62.492
-6.084
-8.87%
1 jan 2000 ano
69.805
+7.313
11.7%
1 jan 2001 ano
78.147
+8.342
11.95%
1 jan 2002 ano
82.303
+4.156
5.32%
1 jan 2003 ano
76.291
-6.013
-7.31%
1 jan 2004 ano
78.331
+2.04
2.67%
1 jan 2005 ano
65.295
-13.036
-16.64%
1 jan 2006 ano
66.359
+1.064
1.63%
1 jan 2007 ano
70.237
+3.878
5.84%
1 jan 2008 ano
68.012
-2.225
-3.17%
1 jan 2009 ano
73.173
+5.16
7.59%
1 jan 2010 ano
77.752
+4.579
6.26%
1 jan 2011 ano
72.89
-4.862
-6.25%
1 jan 2012 ano
68.63
-4.259
-5.84%
1 jan 2013 ano
93.467
+24.837
36.19%
1 jan 2014 ano
92.054
-1.414
-1.51%
1 jan 2015 ano
94.012
+1.958
2.13%
1 jan 2016 ano
93.633
-0.379
-0.4%
Classificação de países por estatísticas atuais por anos


Comentários: