29
/pt/
pt
AIzaSyAYiBZKx7MnpbEhh9jyipgxe19OcubqV5w
April 1, 2024
211191
Nicaragua
NIC
true
2
1
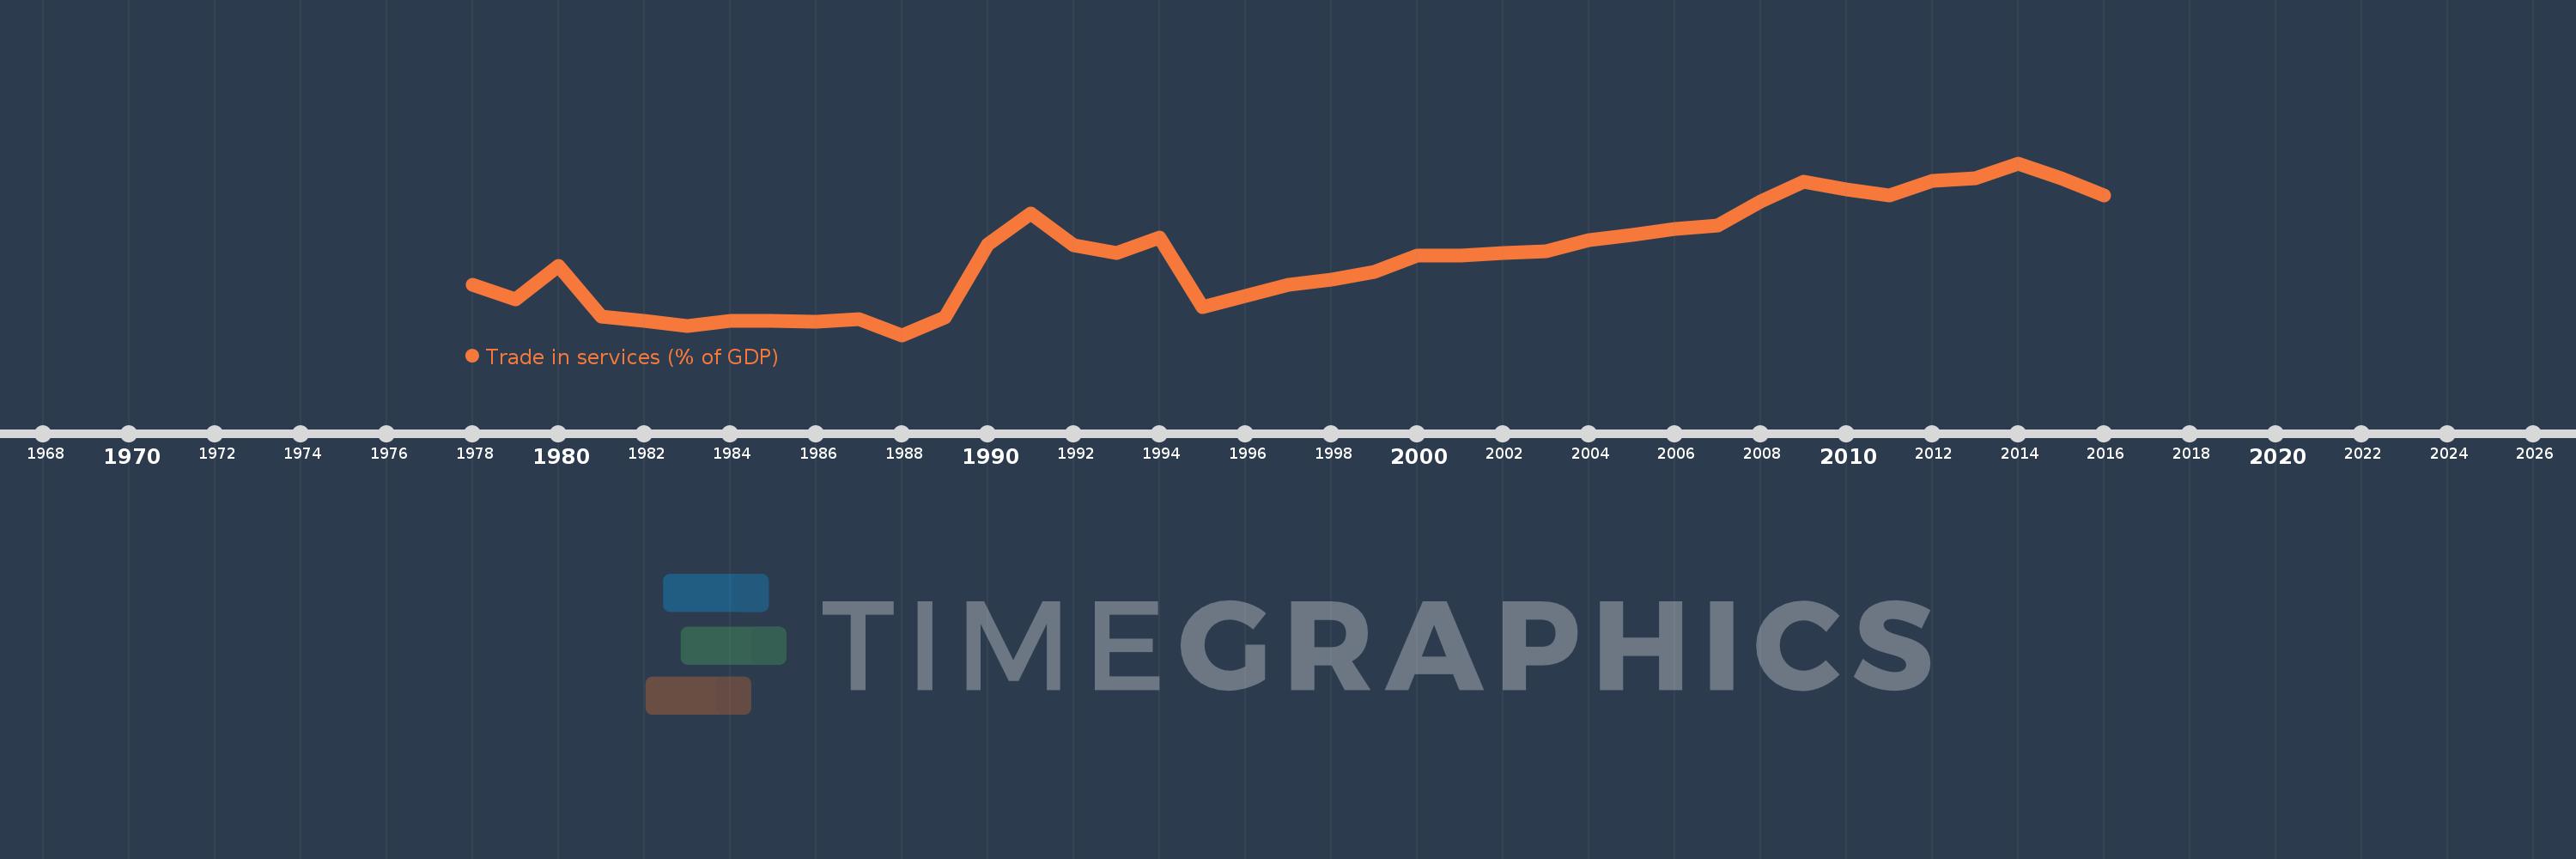
Trade in services (% of GDP)
2016,2015,2014,2013,2012,2011,2010,2009,2008,2007,2006,2005,2004,2003,2002,2001,2000,1999,1998,1997,1996,1995,1994,1993,1992,1991,1990,1989,1988,1987,1986,1985,1984,1983,1982,1981,1980,1979,1978
Estas estatísticas em outros países:
AfghanistanAlbaniaAlgeriaAngolaAntigua and BarbudaArab WorldArgentinaArmeniaArubaAustraliaAustriaAzerbaijanBahamas, TheBahrainBangladeshBarbadosBelarusBelgiumBelizeBeninBermudaBhutanBoliviaBosnia and HerzegovinaBotswanaBrazilBrunei DarussalamBulgariaBurkina FasoBurundiCabo VerdeCambodiaCameroonCanadaCaribbean small statesCentral African RepublicCentral Europe and the BalticsChadChileChinaColombiaComorosCongo, Dem. Rep.Congo, Rep.Costa RicaCote d'IvoireCroatiaCyprusCzech RepublicDenmarkDjiboutiDominicaDominican RepublicEarly-demographic dividendEast Asia & PacificEast Asia & Pacific (excluding high income)East Asia & Pacific (IDA & IBRD countries)EcuadorEgypt, Arab Rep.El SalvadorEquatorial GuineaEritreaEstoniaEthiopiaEuro areaEurope & Central AsiaEurope & Central Asia (excluding high income)Europe & Central Asia (IDA & IBRD countries)European UnionFaroe IslandsFijiFinlandFragile and conflict affected situationsFranceGabonGambia, TheGeorgiaGermanyGhanaGreeceGrenadaGuatemalaGuineaGuinea-BissauGuyanaHaitiHeavily indebted poor countries (HIPC)High incomeHondurasHong Kong SAR, ChinaHungaryIBRD onlyIcelandIDA & IBRD totalIDA blendIDA onlyIDA totalIndiaIndonesiaIran, Islamic Rep.IraqIrelandIsraelItalyJamaicaJapanJordanKazakhstanKenyaKiribatiKorea, Rep.KosovoKuwaitKyrgyz RepublicLao PDRLate-demographic dividendLatin America & Caribbean Latin America & Caribbean (excluding high income)Latin America & the Caribbean (IDA & IBRD countries)LatviaLeast developed countries: UN classificationLebanonLesothoLiberiaLibyaLithuaniaLow & middle incomeLow incomeLower middle incomeLuxembourgMacao SAR, ChinaMacedonia, FYRMadagascarMalawiMalaysiaMaldivesMaliMaltaMarshall IslandsMauritaniaMauritiusMexicoMicronesia, Fed. Sts.Middle East & North AfricaMiddle East & North Africa (excluding high income)Middle East & North Africa (IDA & IBRD countries)Middle incomeMoldovaMongoliaMontenegroMoroccoMozambiqueMyanmarNamibiaNepalNetherlandsNew ZealandNicaraguaNigerNigeriaNorth AmericaNorwayOECD membersOmanOther small statesPacific island small statesPakistanPalauPanamaPapua New GuineaParaguayPeruPhilippinesPolandPortugalPost-demographic dividendPre-demographic dividendQatarRomaniaRussian FederationRwandaSamoaSao Tome and PrincipeSaudi ArabiaSenegalSerbiaSeychellesSierra LeoneSingaporeSlovak RepublicSloveniaSmall statesSolomon IslandsSouth AfricaSouth AsiaSouth Asia (IDA & IBRD)South SudanSpainSri LankaSt. Kitts and NevisSt. LuciaSt. Vincent and the GrenadinesSub-Saharan Africa Sub-Saharan Africa (excluding high income)Sub-Saharan Africa (IDA & IBRD countries)SudanSurinameSwazilandSwedenSwitzerlandSyrian Arab RepublicTajikistanTanzaniaThailandTimor-LesteTogoTongaTrinidad and TobagoTunisiaTurkeyTuvaluUgandaUkraineUnited KingdomUnited StatesUpper middle incomeUruguayVanuatuVenezuela, RBVietnamWest Bank and GazaWorldYemen, Rep.ZambiaZimbabwe Linha do tempo:
Nesta escala de tempo está apresentado um gráfico de 1978 ano até 2016 ano Nicaragua. Dados de 1977 ano ausente. O número de observações reais por data: 39.
Fonte (nome):
Indicadores de desenvolvimento mundial
Fonte (organização):
International Monetary Fund, Balance of Payments Statistics Yearbook and data files, and World Bank and OECD GDP estimates.
Categorias:
Economy & Growth, Private Sector, Trade
Foi atualizado:
23 abr 2017 ano
Indicadores de alterações dos valores ao longo dos anos
Mínimo:
4.934
1 jan 1988 ano
Máximo:
22.033
1 jan 2014 ano
Na data de observação
Valor
Mudança absoluta
A alteração em relação ao valor anterior
1 jan 1978 ano
9.925
+9.925
0.0%
1 jan 1979 ano
8.44
-1.485
-14.96%
1 jan 1980 ano
11.775
+3.334
39.51%
1 jan 1981 ano
6.765
-5.01
-42.55%
1 jan 1982 ano
6.343
-0.421
-6.23%
1 jan 1983 ano
5.854
-0.49
-7.72%
1 jan 1984 ano
6.354
+0.5
8.54%
1 jan 1985 ano
6.356
+0.003
0.05%
1 jan 1986 ano
6.293
-0.063
-0.99%
1 jan 1987 ano
6.536
+0.242
3.85%
1 jan 1988 ano
4.934
-1.602
-24.51%
1 jan 1989 ano
6.671
+1.737
35.21%
1 jan 1990 ano
13.936
+7.266
108.92%
1 jan 1991 ano
17.049
+3.113
22.33%
1 jan 1992 ano
13.863
-3.185
-18.68%
1 jan 1993 ano
13.08
-0.783
-5.65%
1 jan 1994 ano
14.62
+1.54
11.78%
1 jan 1995 ano
7.74
-6.881
-47.06%
1 jan 1996 ano
8.797
+1.057
13.66%
1 jan 1997 ano
9.926
+1.129
12.83%
1 jan 1998 ano
10.406
+0.481
4.84%
1 jan 1999 ano
11.228
+0.822
7.9%
1 jan 2000 ano
12.841
+1.613
14.36%
1 jan 2001 ano
12.813
-0.028
-0.22%
1 jan 2002 ano
13.062
+0.249
1.94%
1 jan 2003 ano
13.254
+0.192
1.47%
1 jan 2004 ano
14.414
+1.161
8.76%
1 jan 2005 ano
14.87
+0.456
3.16%
1 jan 2006 ano
15.486
+0.616
4.14%
1 jan 2007 ano
15.832
+0.346
2.24%
1 jan 2008 ano
18.194
+2.362
14.92%
1 jan 2009 ano
20.209
+2.015
11.08%
1 jan 2010 ano
19.399
-0.809
-4.01%
1 jan 2011 ano
18.853
-0.546
-2.82%
1 jan 2012 ano
20.254
+1.401
7.43%
1 jan 2013 ano
20.527
+0.273
1.35%
1 jan 2014 ano
22.033
+1.506
7.34%
1 jan 2015 ano
20.563
-1.47
-6.67%
1 jan 2016 ano
18.791
-1.772
-8.62%
Classificação de países por estatísticas atuais por anos


Comentários: