29
/pt/
pt
AIzaSyAYiBZKx7MnpbEhh9jyipgxe19OcubqV5w
April 1, 2024
155440
India
IND
true
2
1
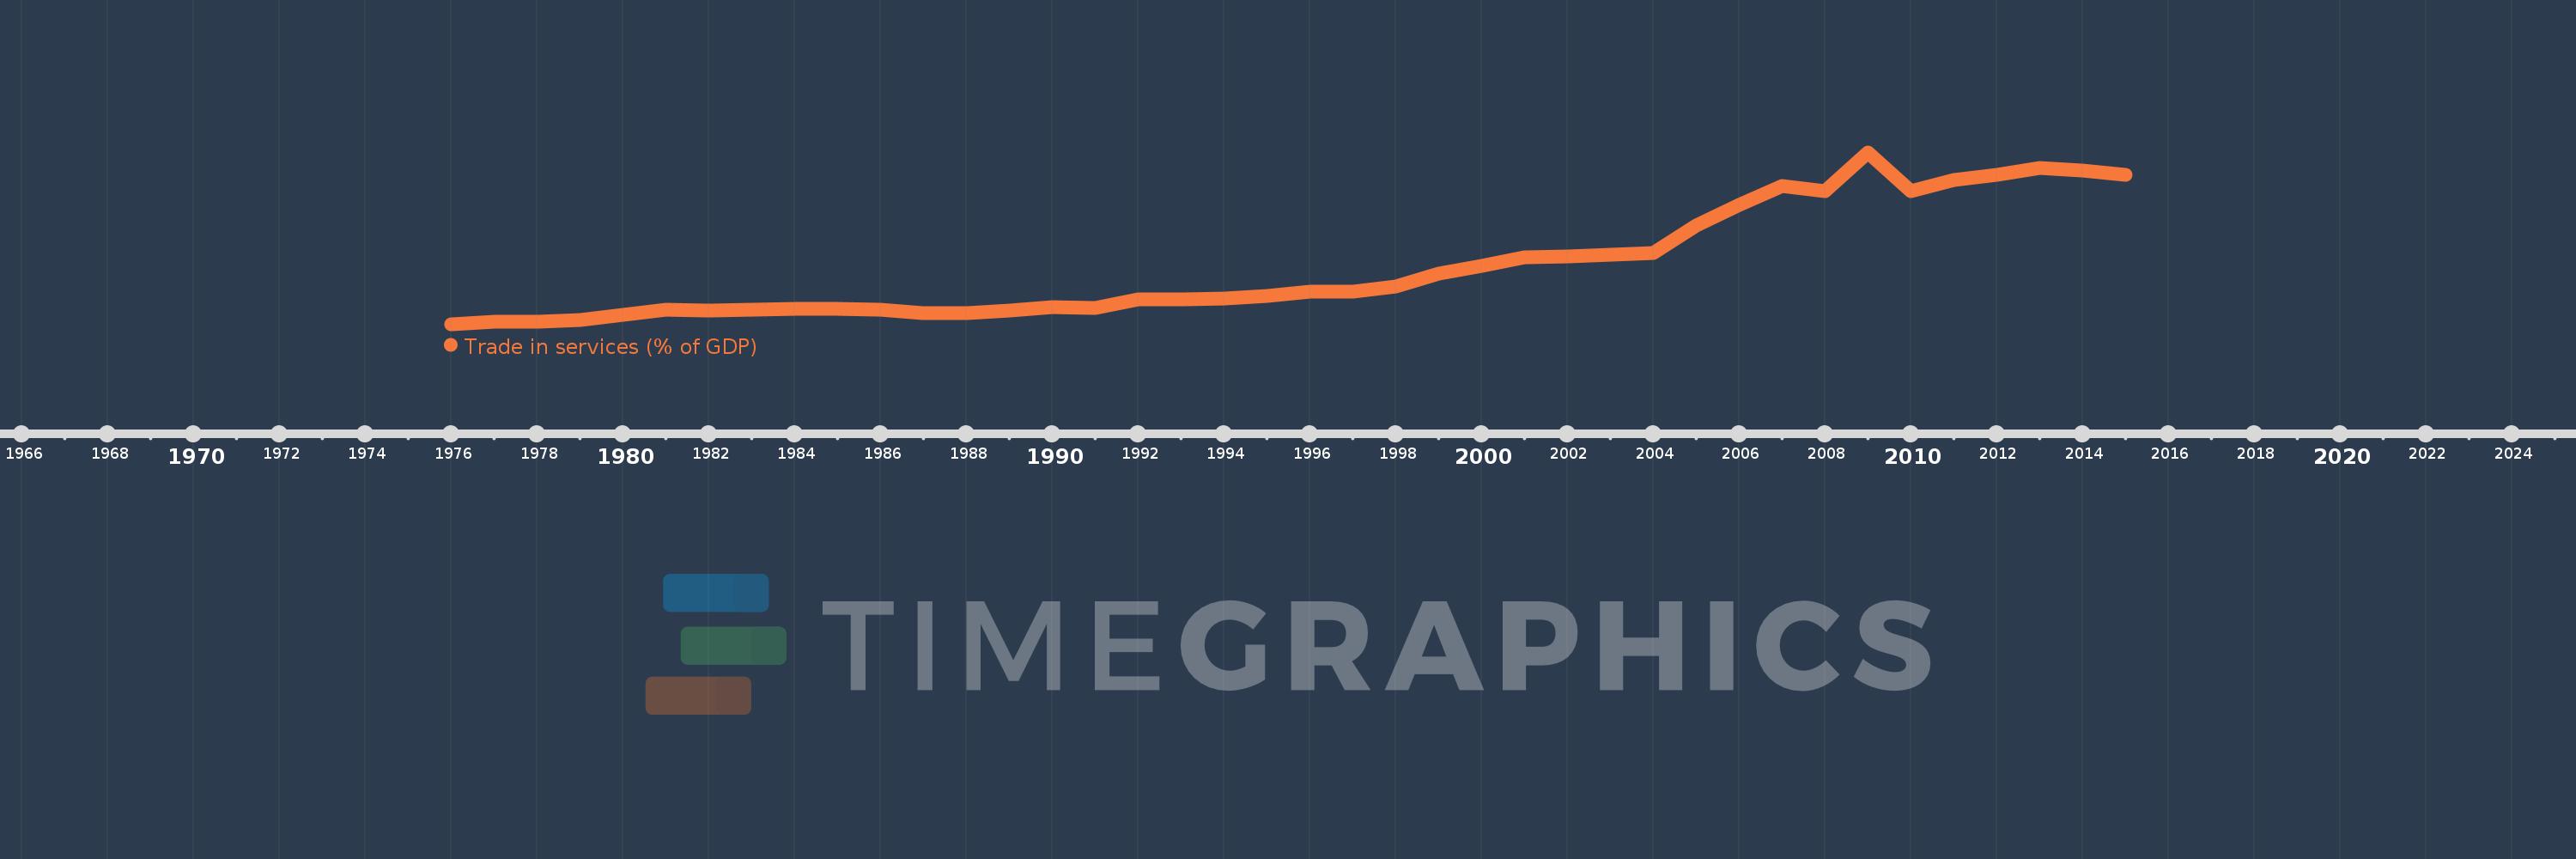
Trade in services (% of GDP)
2015,2014,2013,2012,2011,2010,2009,2008,2007,2006,2005,2004,2003,2002,2001,2000,1999,1998,1997,1996,1995,1994,1993,1992,1991,1990,1989,1988,1987,1986,1985,1984,1983,1982,1981,1980,1979,1978,1977,1976
Estas estatísticas em outros países:
AfghanistanAlbaniaAlgeriaAngolaAntigua and BarbudaArab WorldArgentinaArmeniaArubaAustraliaAustriaAzerbaijanBahamas, TheBahrainBangladeshBarbadosBelarusBelgiumBelizeBeninBermudaBhutanBoliviaBosnia and HerzegovinaBotswanaBrazilBrunei DarussalamBulgariaBurkina FasoBurundiCabo VerdeCambodiaCameroonCanadaCaribbean small statesCentral African RepublicCentral Europe and the BalticsChadChileChinaColombiaComorosCongo, Dem. Rep.Congo, Rep.Costa RicaCote d'IvoireCroatiaCyprusCzech RepublicDenmarkDjiboutiDominicaDominican RepublicEarly-demographic dividendEast Asia & PacificEast Asia & Pacific (excluding high income)East Asia & Pacific (IDA & IBRD countries)EcuadorEgypt, Arab Rep.El SalvadorEquatorial GuineaEritreaEstoniaEthiopiaEuro areaEurope & Central AsiaEurope & Central Asia (excluding high income)Europe & Central Asia (IDA & IBRD countries)European UnionFaroe IslandsFijiFinlandFragile and conflict affected situationsFranceGabonGambia, TheGeorgiaGermanyGhanaGreeceGrenadaGuatemalaGuineaGuinea-BissauGuyanaHaitiHeavily indebted poor countries (HIPC)High incomeHondurasHong Kong SAR, ChinaHungaryIBRD onlyIcelandIDA & IBRD totalIDA blendIDA onlyIDA totalIndiaIndonesiaIran, Islamic Rep.IraqIrelandIsraelItalyJamaicaJapanJordanKazakhstanKenyaKiribatiKorea, Rep.KosovoKuwaitKyrgyz RepublicLao PDRLate-demographic dividendLatin America & Caribbean Latin America & Caribbean (excluding high income)Latin America & the Caribbean (IDA & IBRD countries)LatviaLeast developed countries: UN classificationLebanonLesothoLiberiaLibyaLithuaniaLow & middle incomeLow incomeLower middle incomeLuxembourgMacao SAR, ChinaMacedonia, FYRMadagascarMalawiMalaysiaMaldivesMaliMaltaMarshall IslandsMauritaniaMauritiusMexicoMicronesia, Fed. Sts.Middle East & North AfricaMiddle East & North Africa (excluding high income)Middle East & North Africa (IDA & IBRD countries)Middle incomeMoldovaMongoliaMontenegroMoroccoMozambiqueMyanmarNamibiaNepalNetherlandsNew ZealandNicaraguaNigerNigeriaNorth AmericaNorwayOECD membersOmanOther small statesPacific island small statesPakistanPalauPanamaPapua New GuineaParaguayPeruPhilippinesPolandPortugalPost-demographic dividendPre-demographic dividendQatarRomaniaRussian FederationRwandaSamoaSao Tome and PrincipeSaudi ArabiaSenegalSerbiaSeychellesSierra LeoneSingaporeSlovak RepublicSloveniaSmall statesSolomon IslandsSouth AfricaSouth AsiaSouth Asia (IDA & IBRD)South SudanSpainSri LankaSt. Kitts and NevisSt. LuciaSt. Vincent and the GrenadinesSub-Saharan Africa Sub-Saharan Africa (excluding high income)Sub-Saharan Africa (IDA & IBRD countries)SudanSurinameSwazilandSwedenSwitzerlandSyrian Arab RepublicTajikistanTanzaniaThailandTimor-LesteTogoTongaTrinidad and TobagoTunisiaTurkeyTuvaluUgandaUkraineUnited KingdomUnited StatesUpper middle incomeUruguayVanuatuVenezuela, RBVietnamWest Bank and GazaWorldYemen, Rep.ZambiaZimbabwe Linha do tempo:
Nesta escala de tempo está apresentado um gráfico de 1976 ano até 2015 ano India. Dados de 1975 ano ausente. O número de observações reais por data: 40.
Fonte (nome):
Indicadores de desenvolvimento mundial
Fonte (organização):
International Monetary Fund, Balance of Payments Statistics Yearbook and data files, and World Bank and OECD GDP estimates.
Categorias:
Economy & Growth, Private Sector, Trade
Foi atualizado:
23 abr 2017 ano
Indicadores de alterações dos valores ao longo dos anos
Mínimo:
1.891
1 jan 1976 ano
Máximo:
16.328
1 jan 2009 ano
Na data de observação
Valor
Mudança absoluta
A alteração em relação ao valor anterior
1 jan 1976 ano
1.891
+1.891
0.0%
1 jan 1977 ano
2.101
+0.21
11.1%
1 jan 1978 ano
2.105
+0.004
0.2%
1 jan 1979 ano
2.263
+0.158
7.5%
1 jan 1980 ano
2.7
+0.436
19.28%
1 jan 1981 ano
3.14
+0.44
16.3%
1 jan 1982 ano
3.071
-0.069
-2.19%
1 jan 1983 ano
3.136
+0.065
2.11%
1 jan 1984 ano
3.15
+0.014
0.45%
1 jan 1985 ano
3.184
+0.034
1.09%
1 jan 1986 ano
3.08
-0.104
-3.26%
1 jan 1987 ano
2.831
-0.249
-8.07%
1 jan 1988 ano
2.815
-0.016
-0.58%
1 jan 1989 ano
3.02
+0.205
7.27%
1 jan 1990 ano
3.324
+0.305
10.09%
1 jan 1991 ano
3.281
-0.044
-1.31%
1 jan 1992 ano
3.955
+0.675
20.57%
1 jan 1993 ano
3.979
+0.024
0.6%
1 jan 1994 ano
4.083
+0.104
2.61%
1 jan 1995 ano
4.275
+0.192
4.71%
1 jan 1996 ano
4.649
+0.373
8.73%
1 jan 1997 ano
4.605
-0.044
-0.95%
1 jan 1998 ano
5.093
+0.489
10.61%
1 jan 1999 ano
6.118
+1.025
20.12%
1 jan 2000 ano
6.807
+0.689
11.26%
1 jan 2001 ano
7.527
+0.72
10.57%
1 jan 2002 ano
7.579
+0.052
0.69%
1 jan 2003 ano
7.733
+0.154
2.03%
1 jan 2004 ano
7.889
+0.156
2.01%
1 jan 2005 ano
10.191
+2.303
29.19%
1 jan 2006 ano
11.909
+1.718
16.85%
1 jan 2007 ano
13.481
+1.573
13.2%
1 jan 2008 ano
13.049
-0.432
-3.21%
1 jan 2009 ano
16.328
+3.279
25.12%
1 jan 2010 ano
13.086
-3.242
-19.86%
1 jan 2011 ano
13.993
+0.908
6.94%
1 jan 2012 ano
14.458
+0.465
3.32%
1 jan 2013 ano
15.046
+0.588
4.06%
1 jan 2014 ano
14.782
-0.264
-1.75%
1 jan 2015 ano
14.433
-0.349
-2.36%
Classificação de países por estatísticas atuais por anos


Comentários: