29
/it/
it
AIzaSyAYiBZKx7MnpbEhh9jyipgxe19OcubqV5w
April 1, 2024
99932
Cameroon
CMR
true
2
1
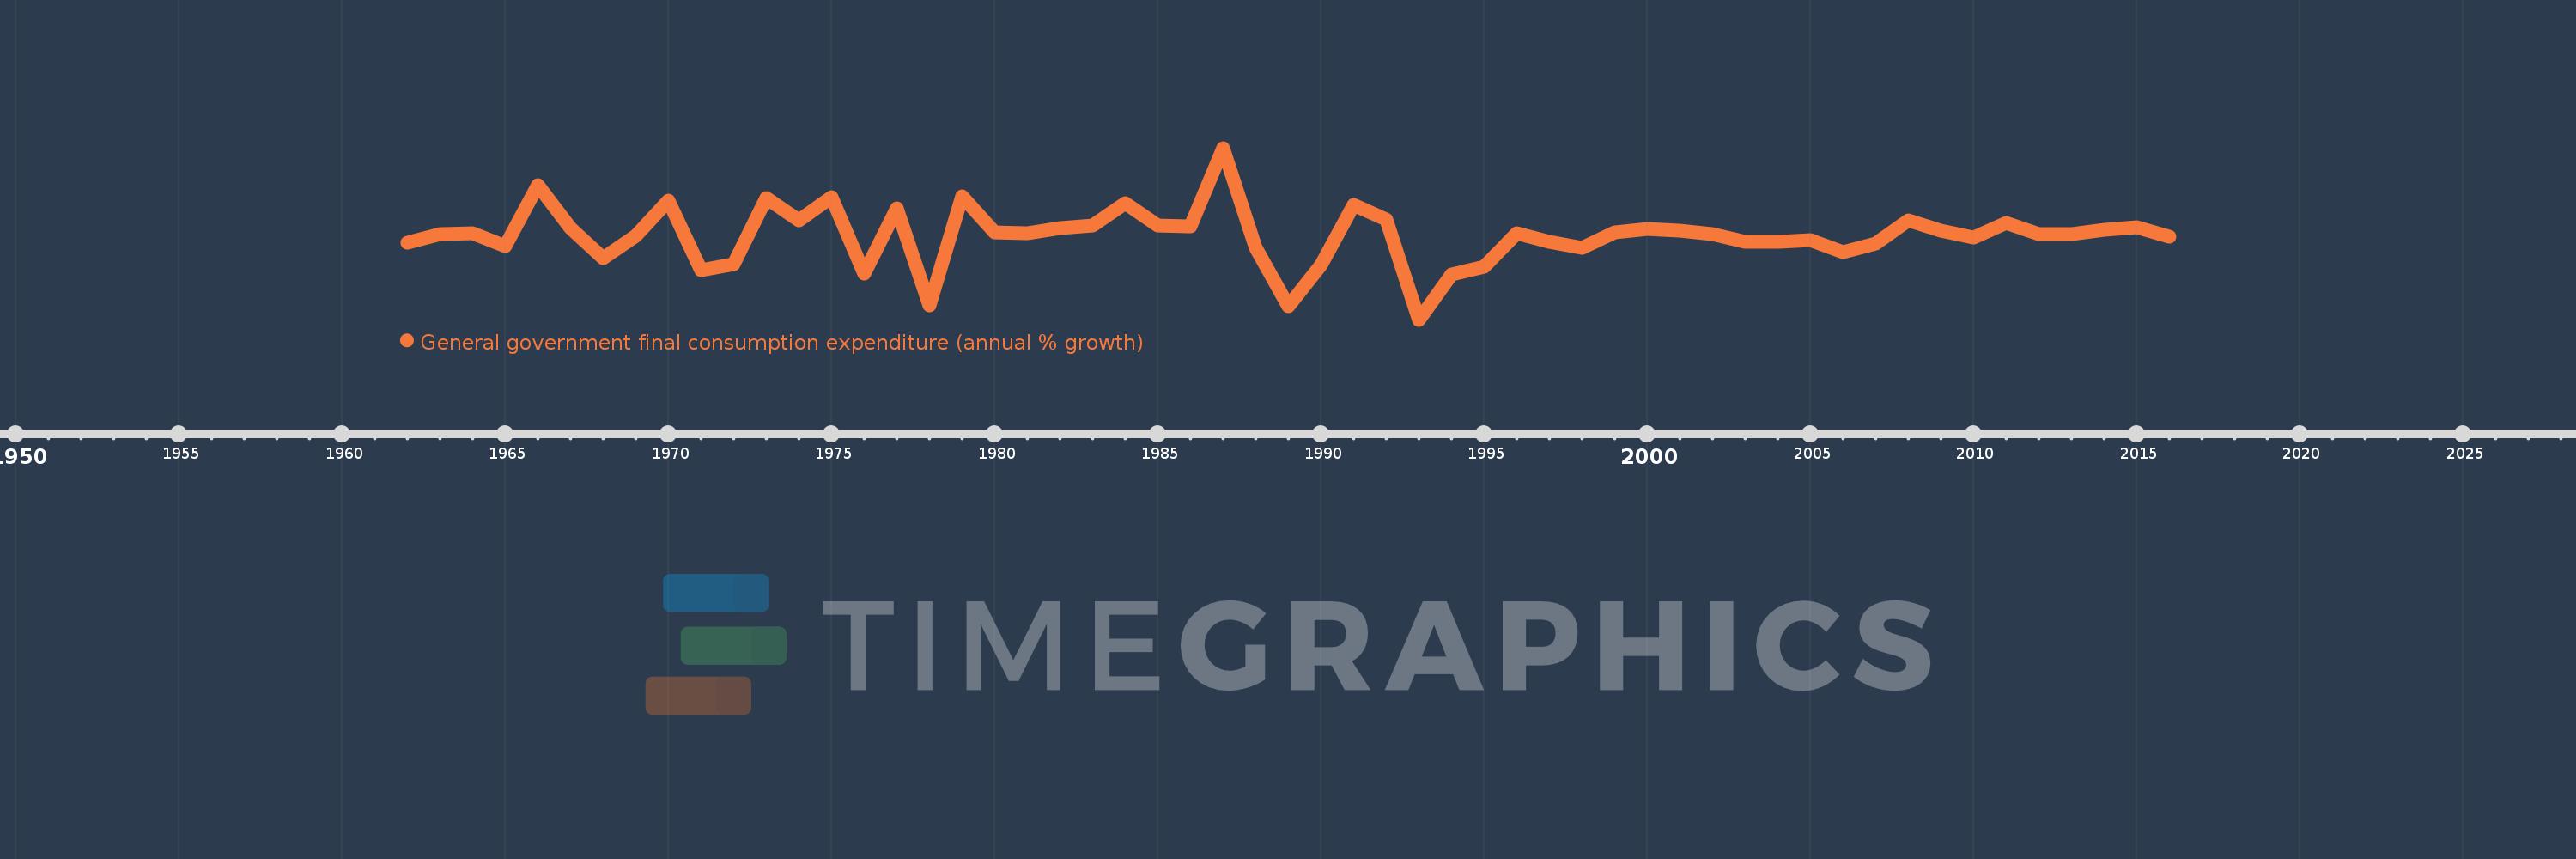
General government final consumption expenditure (annual % growth)
2016,2015,2014,2013,2012,2011,2010,2009,2008,2007,2006,2005,2004,2003,2002,2001,2000,1999,1998,1997,1996,1995,1994,1993,1992,1991,1990,1989,1988,1987,1986,1985,1984,1983,1982,1981,1980,1979,1978,1977,1976,1975,1974,1973,1972,1971,1970,1969,1968,1967,1966,1965,1964,1963,1962
Queste statistiche in altri paesi:
AlbaniaAlgeriaAntigua and BarbudaArab WorldArgentinaArmeniaAustraliaAustriaAzerbaijanBahamas, TheBahrainBangladeshBarbadosBelarusBelgiumBelizeBeninBhutanBoliviaBosnia and HerzegovinaBotswanaBrazilBrunei DarussalamBulgariaBurkina FasoBurundiCabo VerdeCambodiaCameroonCanadaCaribbean small statesCentral Europe and the BalticsChadChileChinaColombiaComorosCongo, Dem. Rep.Congo, Rep.Costa RicaCote d'IvoireCroatiaCubaCyprusCzech RepublicDenmarkDjiboutiDominican RepublicEarly-demographic dividendEast Asia & PacificEast Asia & Pacific (excluding high income)East Asia & Pacific (IDA & IBRD countries)EcuadorEgypt, Arab Rep.El SalvadorEquatorial GuineaEritreaEstoniaEthiopiaEuro areaEurope & Central AsiaEurope & Central Asia (excluding high income)Europe & Central Asia (IDA & IBRD countries)European UnionFijiFinlandFranceGabonGambia, TheGeorgiaGermanyGhanaGreeceGuatemalaGuineaGuinea-BissauHaitiHeavily indebted poor countries (HIPC)High incomeHondurasHong Kong SAR, ChinaHungaryIBRD onlyIcelandIDA & IBRD totalIDA blendIDA onlyIDA totalIndiaIndonesiaIran, Islamic Rep.IrelandIsraelItalyJamaicaJapanJordanKazakhstanKenyaKorea, Rep.KosovoKuwaitKyrgyz RepublicLao PDRLate-demographic dividendLatin America & Caribbean Latin America & Caribbean (excluding high income)Latin America & the Caribbean (IDA & IBRD countries)LatviaLebanonLiberiaLithuaniaLow & middle incomeLow incomeLower middle incomeLuxembourgMacao SAR, ChinaMacedonia, FYRMadagascarMalawiMalaysiaMaliMaltaMauritaniaMauritiusMexicoMiddle East & North AfricaMiddle East & North Africa (excluding high income)Middle East & North Africa (IDA & IBRD countries)Middle incomeMoldovaMongoliaMontenegroMoroccoMozambiqueNamibiaNepalNetherlandsNew ZealandNicaraguaNigerNigeriaNorth AmericaNorwayOECD membersOmanOther small statesPakistanPanamaPapua New GuineaParaguayPeruPhilippinesPolandPortugalPost-demographic dividendPuerto RicoQatarRomaniaRussian FederationRwandaSaudi ArabiaSenegalSerbiaSeychellesSierra LeoneSingaporeSlovak RepublicSloveniaSmall statesSomaliaSouth AfricaSouth AsiaSouth Asia (IDA & IBRD)South SudanSpainSri LankaSub-Saharan Africa Sub-Saharan Africa (excluding high income)Sub-Saharan Africa (IDA & IBRD countries)SudanSurinameSwazilandSwedenSwitzerlandSyrian Arab RepublicTajikistanTanzaniaThailandTimor-LesteTogoTrinidad and TobagoTunisiaTurkeyTurkmenistanUgandaUkraineUnited Arab EmiratesUnited KingdomUnited StatesUpper middle incomeUruguayVanuatuVenezuela, RBVietnamWest Bank and GazaWorldZimbabwe Linea del tempo:
Questa scala temporale mostra un grafico dal 1962 anno al 2016 anno. Cameroon. I dati fino ad 1961 anno non disponibili. Il numero di osservazioni attuali secondo i date: 55.
La fonte (nome):
Indicatori dello sviluppo mondiale
La fonte (organizzazione):
World Bank national accounts data, and OECD National Accounts data files.
Categorie:
Economy & Growth
sono stati aggiornati
23 apr 2017 anni
Indicatori delle variazioni dei valori per anni
Minima:
-16.8
1 gen 1993 anni
Massimo:
27.8
1 gen 1987 anni
Alla data di osservazione
Valore
Variazione assoluta
La variazione rispetto al valore precedente
1 gen 1962 anni
3.247
+3.247
0.0%
1 gen 1963 anni
5.346
+2.099
64.65%
1 gen 1964 anni
5.672
+0.326
6.09%
1 gen 1965 anni
2.26
-3.412
-60.15%
1 gen 1966 anni
18.168
+15.909
703.96%
1 gen 1967 anni
7.026
-11.143
-61.33%
1 gen 1968 anni
-0.814
-7.84
-111.58%
1 gen 1969 anni
5.077
+5.891
-723.94%
1 gen 1970 anni
14.076
+8.998
177.23%
1 gen 1971 anni
-3.867
-17.943
-127.48%
1 gen 1972 anni
-2.299
+1.568
-40.56%
1 gen 1973 anni
14.706
+17.005
-739.69%
1 gen 1974 anni
9.06
-5.646
-38.39%
1 gen 1975 anni
15.047
+5.987
66.08%
1 gen 1976 anni
-4.904
-19.951
-132.59%
1 gen 1977 anni
12.034
+16.938
-345.39%
1 gen 1978 anni
-13.044
-25.078
-208.39%
1 gen 1979 anni
15.295
+28.339
-217.26%
1 gen 1980 anni
5.825
-9.47
-61.91%
1 gen 1981 anni
5.629
-0.196
-3.37%
1 gen 1982 anni
7.0
+1.371
24.36%
1 gen 1983 anni
7.6
+0.6
8.57%
1 gen 1984 anni
13.5
+5.9
77.63%
1 gen 1985 anni
7.7
-5.8
-42.96%
1 gen 1986 anni
7.4
-0.3
-3.9%
1 gen 1987 anni
27.8
+20.4
275.68%
1 gen 1988 anni
1.8
-26.0
-93.53%
1 gen 1989 anni
-13.3
-15.1
-838.89%
1 gen 1990 anni
-2.5
+10.8
-81.2%
1 gen 1991 anni
13.0
+15.5
-620.0%
1 gen 1992 anni
9.2
-3.8
-29.23%
1 gen 1993 anni
-16.8
-26.0
-282.61%
1 gen 1994 anni
-4.978
+11.822
-70.37%
1 gen 1995 anni
-3.033
+1.945
-39.07%
1 gen 1996 anni
5.712
+8.745
-288.35%
1 gen 1997 anni
3.491
-2.221
-38.88%
1 gen 1998 anni
1.755
-1.737
-49.74%
1 gen 1999 anni
5.79
+4.035
229.95%
1 gen 2000 anni
6.737
+0.947
16.35%
1 gen 2001 anni
6.392
-0.344
-5.11%
1 gen 2002 anni
5.534
-0.858
-13.43%
1 gen 2003 anni
3.48
-2.054
-37.12%
1 gen 2004 anni
3.444
-0.036
-1.04%
1 gen 2005 anni
3.883
+0.439
12.75%
1 gen 2006 anni
0.679
-3.204
-82.52%
1 gen 2007 anni
2.954
+2.275
335.14%
1 gen 2008 anni
9.076
+6.121
207.21%
1 gen 2009 anni
6.312
-2.763
-30.45%
1 gen 2010 anni
4.626
-1.687
-26.72%
1 gen 2011 anni
8.395
+3.77
81.49%
1 gen 2012 anni
5.459
-2.937
-34.98%
1 gen 2013 anni
5.472
+0.014
0.25%
1 gen 2014 anni
6.467
+0.995
18.17%
1 gen 2015 anni
7.176
+0.709
10.96%
1 gen 2016 anni
4.84
-2.336
-32.56%
Classificazione dei paesi secondo i statistiche attuali per anni


Commenti: