29
/it/
it
AIzaSyAYiBZKx7MnpbEhh9jyipgxe19OcubqV5w
April 1, 2024
216435
Pakistan
PAK
true
2
1
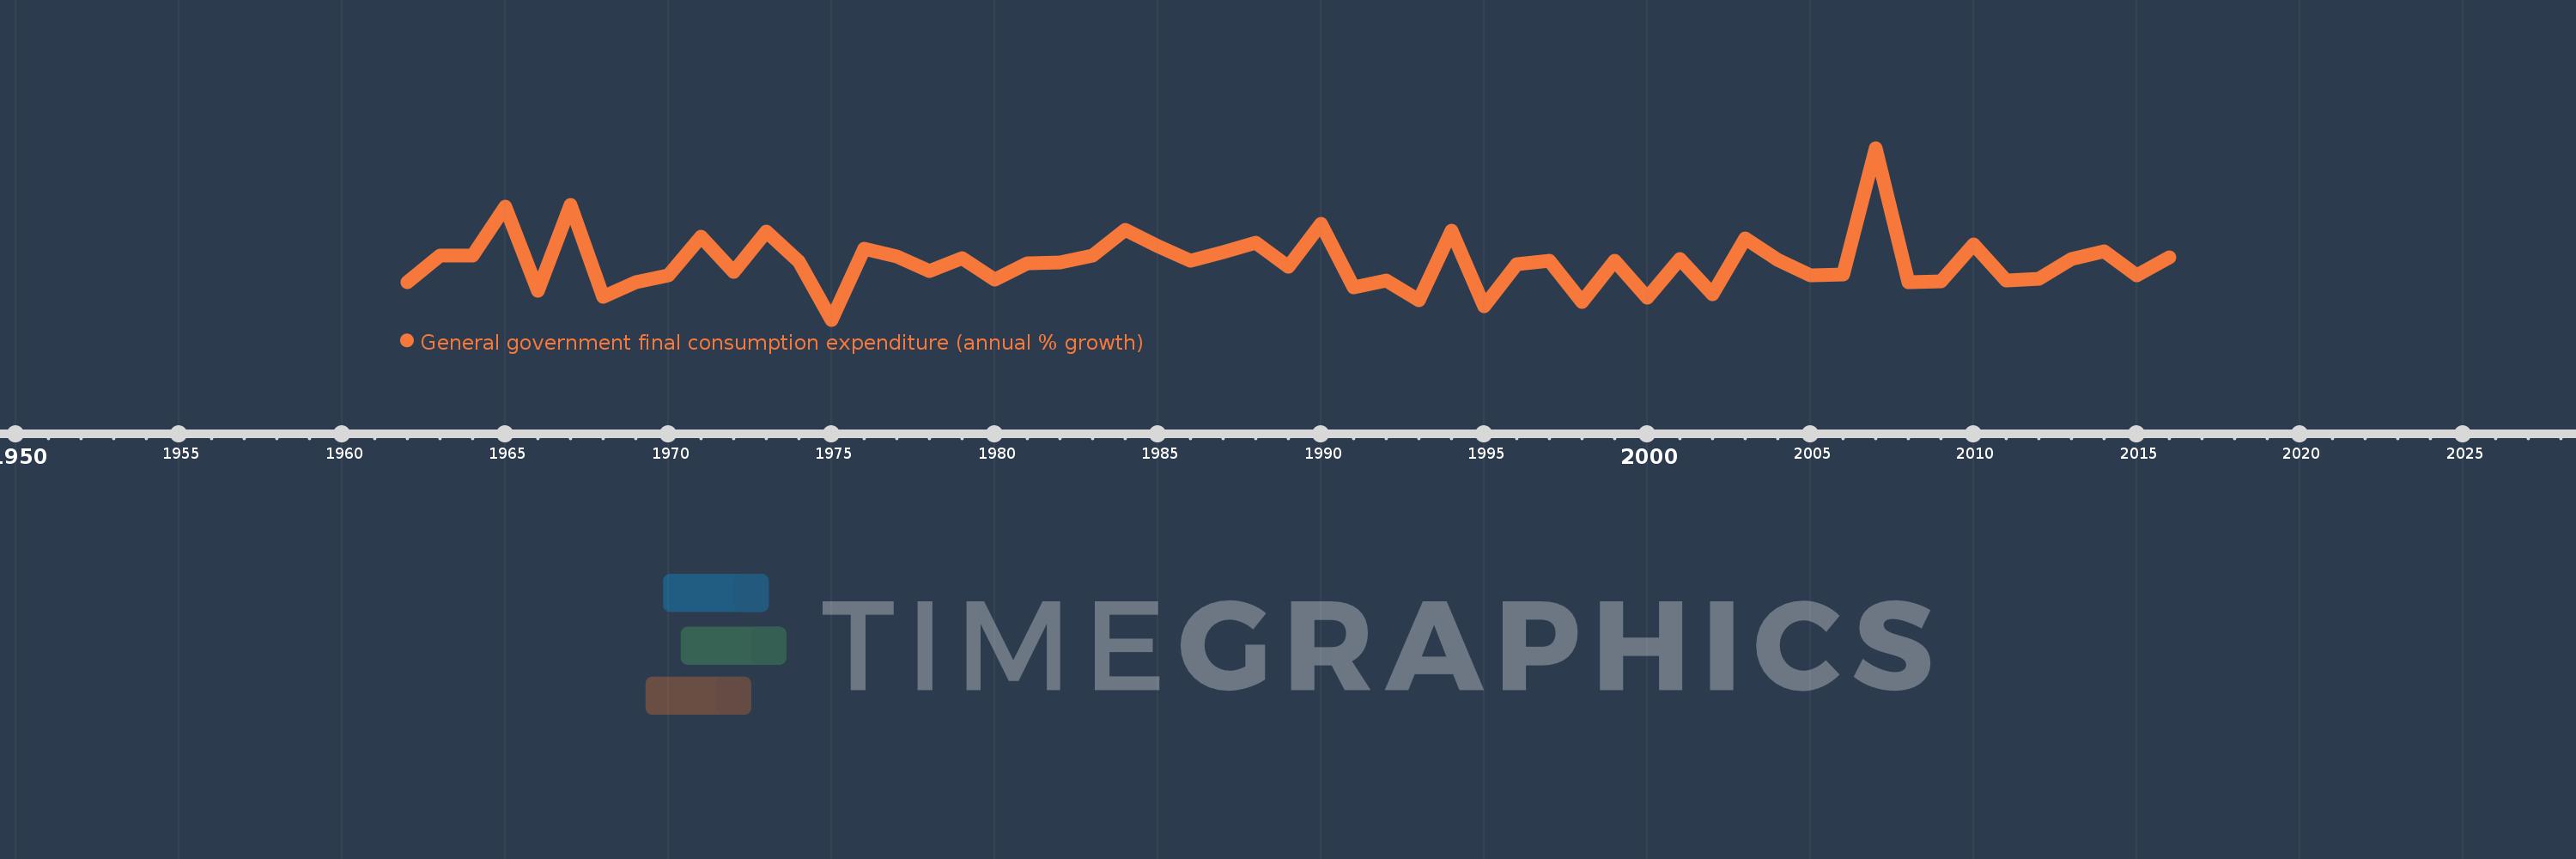
General government final consumption expenditure (annual % growth)
2016,2015,2014,2013,2012,2011,2010,2009,2008,2007,2006,2005,2004,2003,2002,2001,2000,1999,1998,1997,1996,1995,1994,1993,1992,1991,1990,1989,1988,1987,1986,1985,1984,1983,1982,1981,1980,1979,1978,1977,1976,1975,1974,1973,1972,1971,1970,1969,1968,1967,1966,1965,1964,1963,1962
Queste statistiche in altri paesi:
AlbaniaAlgeriaAntigua and BarbudaArab WorldArgentinaArmeniaAustraliaAustriaAzerbaijanBahamas, TheBahrainBangladeshBarbadosBelarusBelgiumBelizeBeninBhutanBoliviaBosnia and HerzegovinaBotswanaBrazilBrunei DarussalamBulgariaBurkina FasoBurundiCabo VerdeCambodiaCameroonCanadaCaribbean small statesCentral Europe and the BalticsChadChileChinaColombiaComorosCongo, Dem. Rep.Congo, Rep.Costa RicaCote d'IvoireCroatiaCubaCyprusCzech RepublicDenmarkDjiboutiDominican RepublicEarly-demographic dividendEast Asia & PacificEast Asia & Pacific (excluding high income)East Asia & Pacific (IDA & IBRD countries)EcuadorEgypt, Arab Rep.El SalvadorEquatorial GuineaEritreaEstoniaEthiopiaEuro areaEurope & Central AsiaEurope & Central Asia (excluding high income)Europe & Central Asia (IDA & IBRD countries)European UnionFijiFinlandFranceGabonGambia, TheGeorgiaGermanyGhanaGreeceGuatemalaGuineaGuinea-BissauHaitiHeavily indebted poor countries (HIPC)High incomeHondurasHong Kong SAR, ChinaHungaryIBRD onlyIcelandIDA & IBRD totalIDA blendIDA onlyIDA totalIndiaIndonesiaIran, Islamic Rep.IrelandIsraelItalyJamaicaJapanJordanKazakhstanKenyaKorea, Rep.KosovoKuwaitKyrgyz RepublicLao PDRLate-demographic dividendLatin America & Caribbean Latin America & Caribbean (excluding high income)Latin America & the Caribbean (IDA & IBRD countries)LatviaLebanonLiberiaLithuaniaLow & middle incomeLow incomeLower middle incomeLuxembourgMacao SAR, ChinaMacedonia, FYRMadagascarMalawiMalaysiaMaliMaltaMauritaniaMauritiusMexicoMiddle East & North AfricaMiddle East & North Africa (excluding high income)Middle East & North Africa (IDA & IBRD countries)Middle incomeMoldovaMongoliaMontenegroMoroccoMozambiqueNamibiaNepalNetherlandsNew ZealandNicaraguaNigerNigeriaNorth AmericaNorwayOECD membersOmanOther small statesPakistanPanamaPapua New GuineaParaguayPeruPhilippinesPolandPortugalPost-demographic dividendPuerto RicoQatarRomaniaRussian FederationRwandaSaudi ArabiaSenegalSerbiaSeychellesSierra LeoneSingaporeSlovak RepublicSloveniaSmall statesSomaliaSouth AfricaSouth AsiaSouth Asia (IDA & IBRD)South SudanSpainSri LankaSub-Saharan Africa Sub-Saharan Africa (excluding high income)Sub-Saharan Africa (IDA & IBRD countries)SudanSurinameSwazilandSwedenSwitzerlandSyrian Arab RepublicTajikistanTanzaniaThailandTimor-LesteTogoTrinidad and TobagoTunisiaTurkeyTurkmenistanUgandaUkraineUnited Arab EmiratesUnited KingdomUnited StatesUpper middle incomeUruguayVanuatuVenezuela, RBVietnamWest Bank and GazaWorldZimbabwe Linea del tempo:
Questa scala temporale mostra un grafico dal 1962 anno al 2016 anno. Pakistan. I dati fino ad 1961 anno non disponibili. Il numero di osservazioni attuali secondo i date: 55.
La fonte (nome):
Indicatori dello sviluppo mondiale
La fonte (organizzazione):
World Bank national accounts data, and OECD National Accounts data files.
Categorie:
Economy & Growth
sono stati aggiornati
23 apr 2017 anni
Indicatori delle variazioni dei valori per anni
Minima:
-15.028
1 gen 1975 anni
Massimo:
48.324
1 gen 2007 anni
Alla data di osservazione
Valore
Variazione assoluta
La variazione rispetto al valore precedente
1 gen 1962 anni
-1.094
-1.094
0.0%
1 gen 1963 anni
8.758
+9.852
-900.5%
1 gen 1964 anni
8.766
+0.008
0.09%
1 gen 1965 anni
26.81
+18.044
205.84%
1 gen 1966 anni
-4.235
-31.045
-115.79%
1 gen 1967 anni
27.205
+31.439
-742.44%
1 gen 1968 anni
-6.497
-33.701
-123.88%
1 gen 1969 anni
-1.048
+5.449
-83.87%
1 gen 1970 anni
1.349
+2.397
-228.74%
1 gen 1971 anni
15.713
+14.364
1.06 Mille.%
1 gen 1972 anni
2.623
-13.09
-83.31%
1 gen 1973 anni
17.452
+14.83
565.44%
1 gen 1974 anni
6.303
-11.149
-63.88%
1 gen 1975 anni
-15.028
-21.332
-338.42%
1 gen 1976 anni
11.315
+26.344
-175.29%
1 gen 1977 anni
8.376
-2.939
-25.98%
1 gen 1978 anni
2.859
-5.517
-65.86%
1 gen 1979 anni
7.578
+4.718
165.01%
1 gen 1980 anni
-0.313
-7.89
-104.13%
1 gen 1981 anni
5.839
+6.152
-1.97 Mille.%
1 gen 1982 anni
6.054
+0.214
3.67%
1 gen 1983 anni
8.728
+2.675
44.18%
1 gen 1984 anni
18.033
+9.305
106.6%
1 gen 1985 anni
12.202
-5.83
-32.33%
1 gen 1986 anni
6.757
-5.446
-44.63%
1 gen 1987 anni
10.028
+3.272
48.42%
1 gen 1988 anni
13.24
+3.211
32.02%
1 gen 1989 anni
4.358
-8.882
-67.09%
1 gen 1990 anni
20.408
+16.05
368.32%
1 gen 1991 anni
-3.168
-23.576
-115.52%
1 gen 1992 anni
-0.501
+2.667
-84.19%
1 gen 1993 anni
-7.868
-7.368
1.47 Mille.%
1 gen 1994 anni
17.758
+25.626
-325.69%
1 gen 1995 anni
-10.213
-27.971
-157.51%
1 gen 1996 anni
5.466
+15.679
-153.52%
1 gen 1997 anni
6.805
+1.339
24.5%
1 gen 1998 anni
-8.355
-15.16
-222.77%
1 gen 1999 anni
6.819
+15.174
-181.62%
1 gen 2000 anni
-6.925
-13.744
-201.55%
1 gen 2001 anni
7.521
+14.445
-208.61%
1 gen 2002 anni
-5.631
-13.152
-174.87%
1 gen 2003 anni
15.028
+20.659
-366.88%
1 gen 2004 anni
7.203
-7.825
-52.07%
1 gen 2005 anni
1.428
-5.775
-80.18%
1 gen 2006 anni
1.665
+0.237
16.63%
1 gen 2007 anni
48.324
+46.659
2.8 Mille.%
1 gen 2008 anni
-1.08
-49.404
-102.24%
1 gen 2009 anni
-0.926
+0.154
-14.28%
1 gen 2010 anni
12.658
+13.584
-1.47 Mille.%
1 gen 2011 anni
-0.577
-13.235
-104.56%
1 gen 2012 anni
0.021
+0.598
-103.61%
1 gen 2013 anni
7.346
+7.325
35.18 Mille.%
1 gen 2014 anni
10.074
+2.728
37.14%
1 gen 2015 anni
1.502
-8.571
-85.09%
1 gen 2016 anni
8.131
+6.629
441.23%
Classificazione dei paesi secondo i statistiche attuali per anni


Commenti: