29
/it/
it
AIzaSyAYiBZKx7MnpbEhh9jyipgxe19OcubqV5w
April 1, 2024
115805
Cuba
CUB
true
2
1
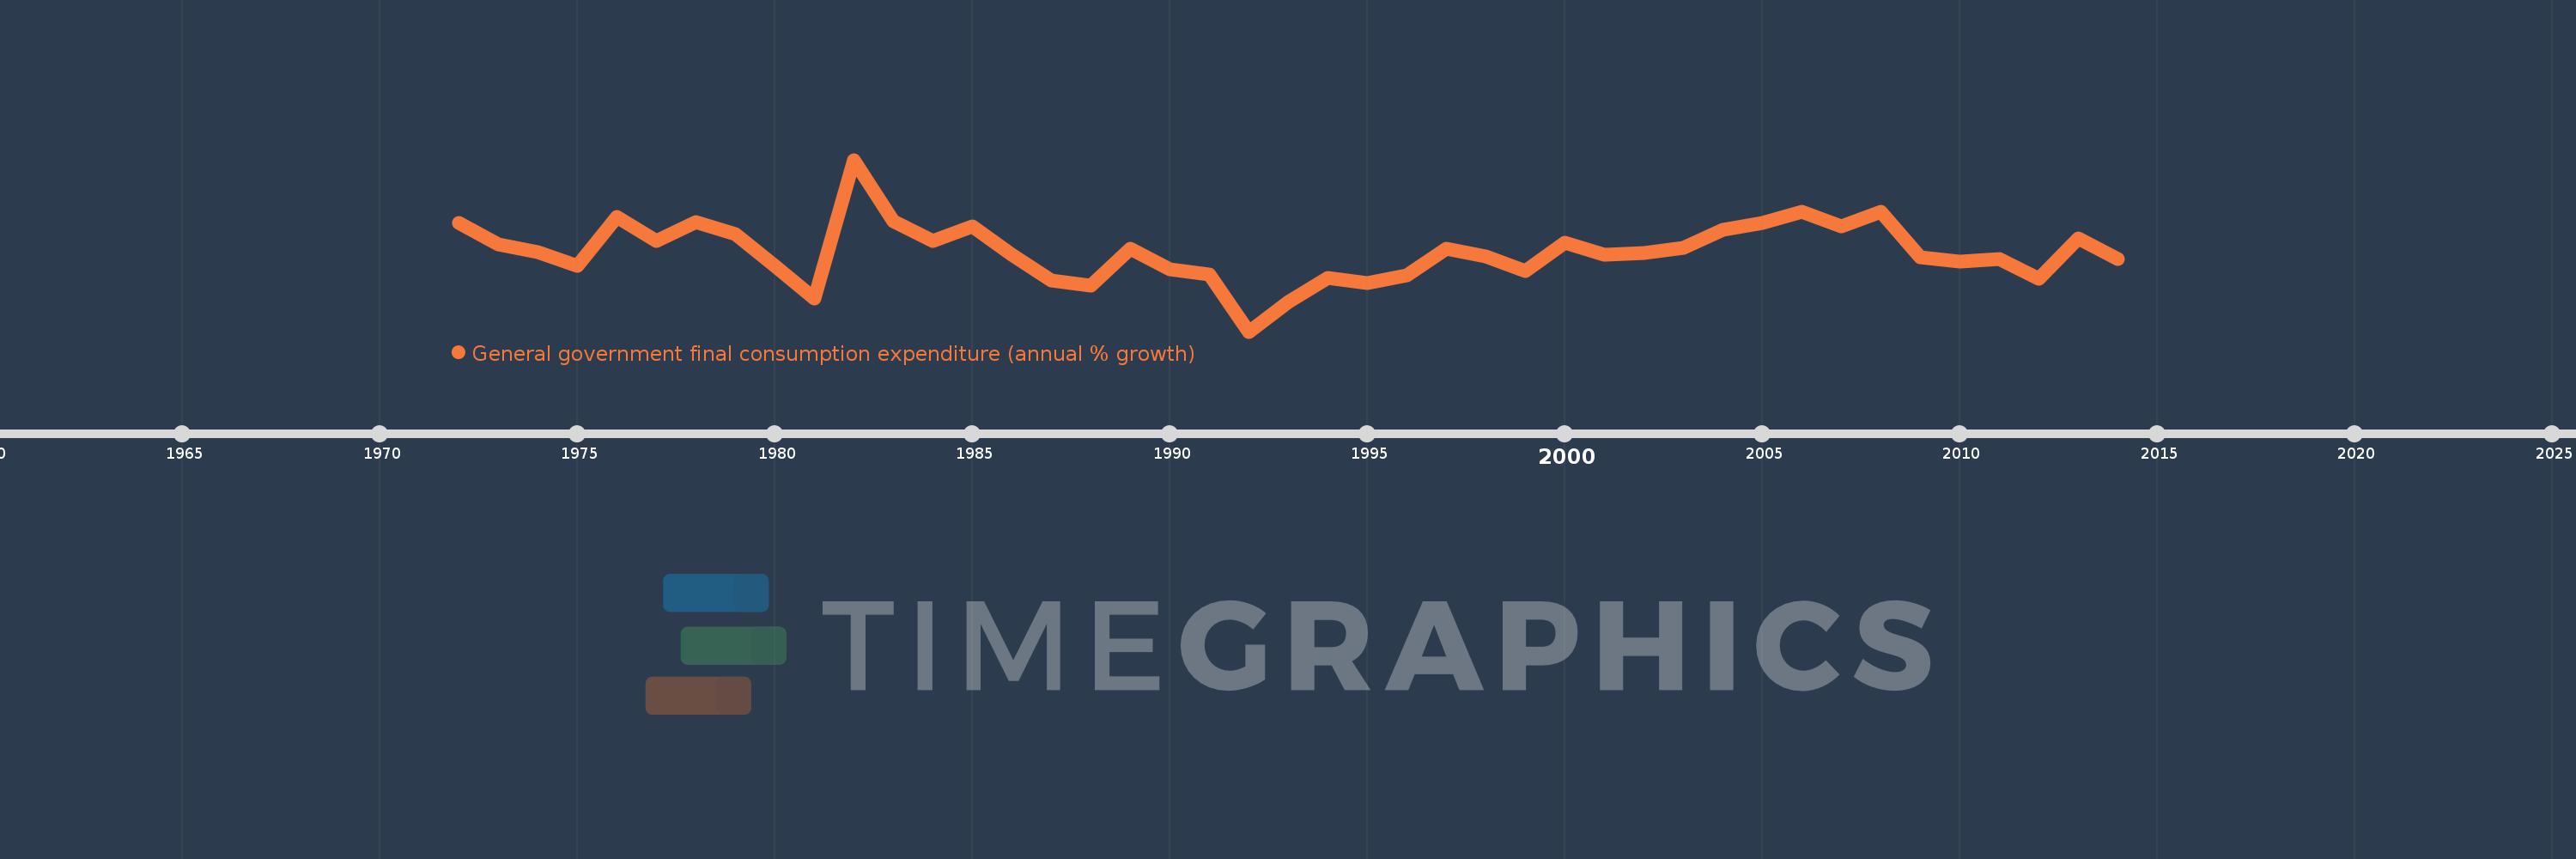
General government final consumption expenditure (annual % growth)
2014,2013,2012,2011,2010,2009,2008,2007,2006,2005,2004,2003,2002,2001,2000,1999,1998,1997,1996,1995,1994,1993,1992,1991,1990,1989,1988,1987,1986,1985,1984,1983,1982,1981,1980,1979,1978,1977,1976,1975,1974,1973,1972
Queste statistiche in altri paesi:
AlbaniaAlgeriaAntigua and BarbudaArab WorldArgentinaArmeniaAustraliaAustriaAzerbaijanBahamas, TheBahrainBangladeshBarbadosBelarusBelgiumBelizeBeninBhutanBoliviaBosnia and HerzegovinaBotswanaBrazilBrunei DarussalamBulgariaBurkina FasoBurundiCabo VerdeCambodiaCameroonCanadaCaribbean small statesCentral Europe and the BalticsChadChileChinaColombiaComorosCongo, Dem. Rep.Congo, Rep.Costa RicaCote d'IvoireCroatiaCubaCyprusCzech RepublicDenmarkDjiboutiDominican RepublicEarly-demographic dividendEast Asia & PacificEast Asia & Pacific (excluding high income)East Asia & Pacific (IDA & IBRD countries)EcuadorEgypt, Arab Rep.El SalvadorEquatorial GuineaEritreaEstoniaEthiopiaEuro areaEurope & Central AsiaEurope & Central Asia (excluding high income)Europe & Central Asia (IDA & IBRD countries)European UnionFijiFinlandFranceGabonGambia, TheGeorgiaGermanyGhanaGreeceGuatemalaGuineaGuinea-BissauHaitiHeavily indebted poor countries (HIPC)High incomeHondurasHong Kong SAR, ChinaHungaryIBRD onlyIcelandIDA & IBRD totalIDA blendIDA onlyIDA totalIndiaIndonesiaIran, Islamic Rep.IrelandIsraelItalyJamaicaJapanJordanKazakhstanKenyaKorea, Rep.KosovoKuwaitKyrgyz RepublicLao PDRLate-demographic dividendLatin America & Caribbean Latin America & Caribbean (excluding high income)Latin America & the Caribbean (IDA & IBRD countries)LatviaLebanonLiberiaLithuaniaLow & middle incomeLow incomeLower middle incomeLuxembourgMacao SAR, ChinaMacedonia, FYRMadagascarMalawiMalaysiaMaliMaltaMauritaniaMauritiusMexicoMiddle East & North AfricaMiddle East & North Africa (excluding high income)Middle East & North Africa (IDA & IBRD countries)Middle incomeMoldovaMongoliaMontenegroMoroccoMozambiqueNamibiaNepalNetherlandsNew ZealandNicaraguaNigerNigeriaNorth AmericaNorwayOECD membersOmanOther small statesPakistanPanamaPapua New GuineaParaguayPeruPhilippinesPolandPortugalPost-demographic dividendPuerto RicoQatarRomaniaRussian FederationRwandaSaudi ArabiaSenegalSerbiaSeychellesSierra LeoneSingaporeSlovak RepublicSloveniaSmall statesSomaliaSouth AfricaSouth AsiaSouth Asia (IDA & IBRD)South SudanSpainSri LankaSub-Saharan Africa Sub-Saharan Africa (excluding high income)Sub-Saharan Africa (IDA & IBRD countries)SudanSurinameSwazilandSwedenSwitzerlandSyrian Arab RepublicTajikistanTanzaniaThailandTimor-LesteTogoTrinidad and TobagoTunisiaTurkeyTurkmenistanUgandaUkraineUnited Arab EmiratesUnited KingdomUnited StatesUpper middle incomeUruguayVanuatuVenezuela, RBVietnamWest Bank and GazaWorldZimbabwe Linea del tempo:
Questa scala temporale mostra un grafico dal 1972 anno al 2014 anno. Cuba. I dati fino ad 1971 anno non disponibili. Il numero di osservazioni attuali secondo i date: 43.
La fonte (nome):
Indicatori dello sviluppo mondiale
La fonte (organizzazione):
World Bank national accounts data, and OECD National Accounts data files.
Categorie:
Economy & Growth
sono stati aggiornati
23 apr 2017 anni
Indicatori delle variazioni dei valori per anni
Minima:
-10.447
1 gen 1992 anni
Massimo:
19.541
1 gen 1982 anni
Alla data di osservazione
Valore
Variazione assoluta
La variazione rispetto al valore precedente
1 gen 1972 anni
8.586
+8.586
0.0%
1 gen 1973 anni
4.825
-3.761
-43.8%
1 gen 1974 anni
3.43
-1.395
-28.92%
1 gen 1975 anni
0.976
-2.454
-71.55%
1 gen 1976 anni
9.504
+8.528
873.99%
1 gen 1977 anni
5.428
-4.076
-42.88%
1 gen 1978 anni
8.69
+3.261
60.08%
1 gen 1979 anni
6.574
-2.115
-24.34%
1 gen 1980 anni
1.058
-5.516
-83.9%
1 gen 1981 anni
-4.666
-5.724
-540.85%
1 gen 1982 anni
19.541
+24.206
-518.82%
1 gen 1983 anni
8.797
-10.744
-54.98%
1 gen 1984 anni
5.379
-3.418
-38.86%
1 gen 1985 anni
7.849
+2.47
45.92%
1 gen 1986 anni
2.927
-4.922
-62.71%
1 gen 1987 anni
-1.595
-4.522
-154.51%
1 gen 1988 anni
-2.451
-0.856
53.63%
1 gen 1989 anni
4.092
+6.543
-266.97%
1 gen 1990 anni
0.383
-3.709
-90.63%
1 gen 1991 anni
-0.471
-0.855
-222.89%
1 gen 1992 anni
-10.447
-9.976
2.12 Mille.%
1 gen 1993 anni
-5.229
+5.218
-49.95%
1 gen 1994 anni
-1.065
+4.164
-79.63%
1 gen 1995 anni
-1.916
-0.851
79.89%
1 gen 1996 anni
-0.608
+1.308
-68.29%
1 gen 1997 anni
3.999
+4.606
-758.12%
1 gen 1998 anni
2.664
-1.335
-33.38%
1 gen 1999 anni
0.135
-2.529
-94.93%
1 gen 2000 anni
5.106
+4.971
3.68 Mille.%
1 gen 2001 anni
3.039
-2.067
-40.48%
1 gen 2002 anni
3.277
+0.238
7.84%
1 gen 2003 anni
4.13
+0.852
26.01%
1 gen 2004 anni
7.286
+3.156
76.42%
1 gen 2005 anni
8.562
+1.276
17.51%
1 gen 2006 anni
10.399
+1.838
21.46%
1 gen 2007 anni
7.891
-2.508
-24.12%
1 gen 2008 anni
10.467
+2.576
32.64%
1 gen 2009 anni
2.553
-7.914
-75.61%
1 gen 2010 anni
1.732
-0.821
-32.16%
1 gen 2011 anni
2.237
+0.505
29.14%
1 gen 2012 anni
-1.161
-3.398
-151.89%
1 gen 2013 anni
5.821
+6.982
-601.53%
1 gen 2014 anni
2.206
-3.615
-62.1%
Classificazione dei paesi secondo i statistiche attuali per anni


Commenti: