29
/it/
it
AIzaSyAYiBZKx7MnpbEhh9jyipgxe19OcubqV5w
April 1, 2024
207949
Netherlands
NLD
true
2
1
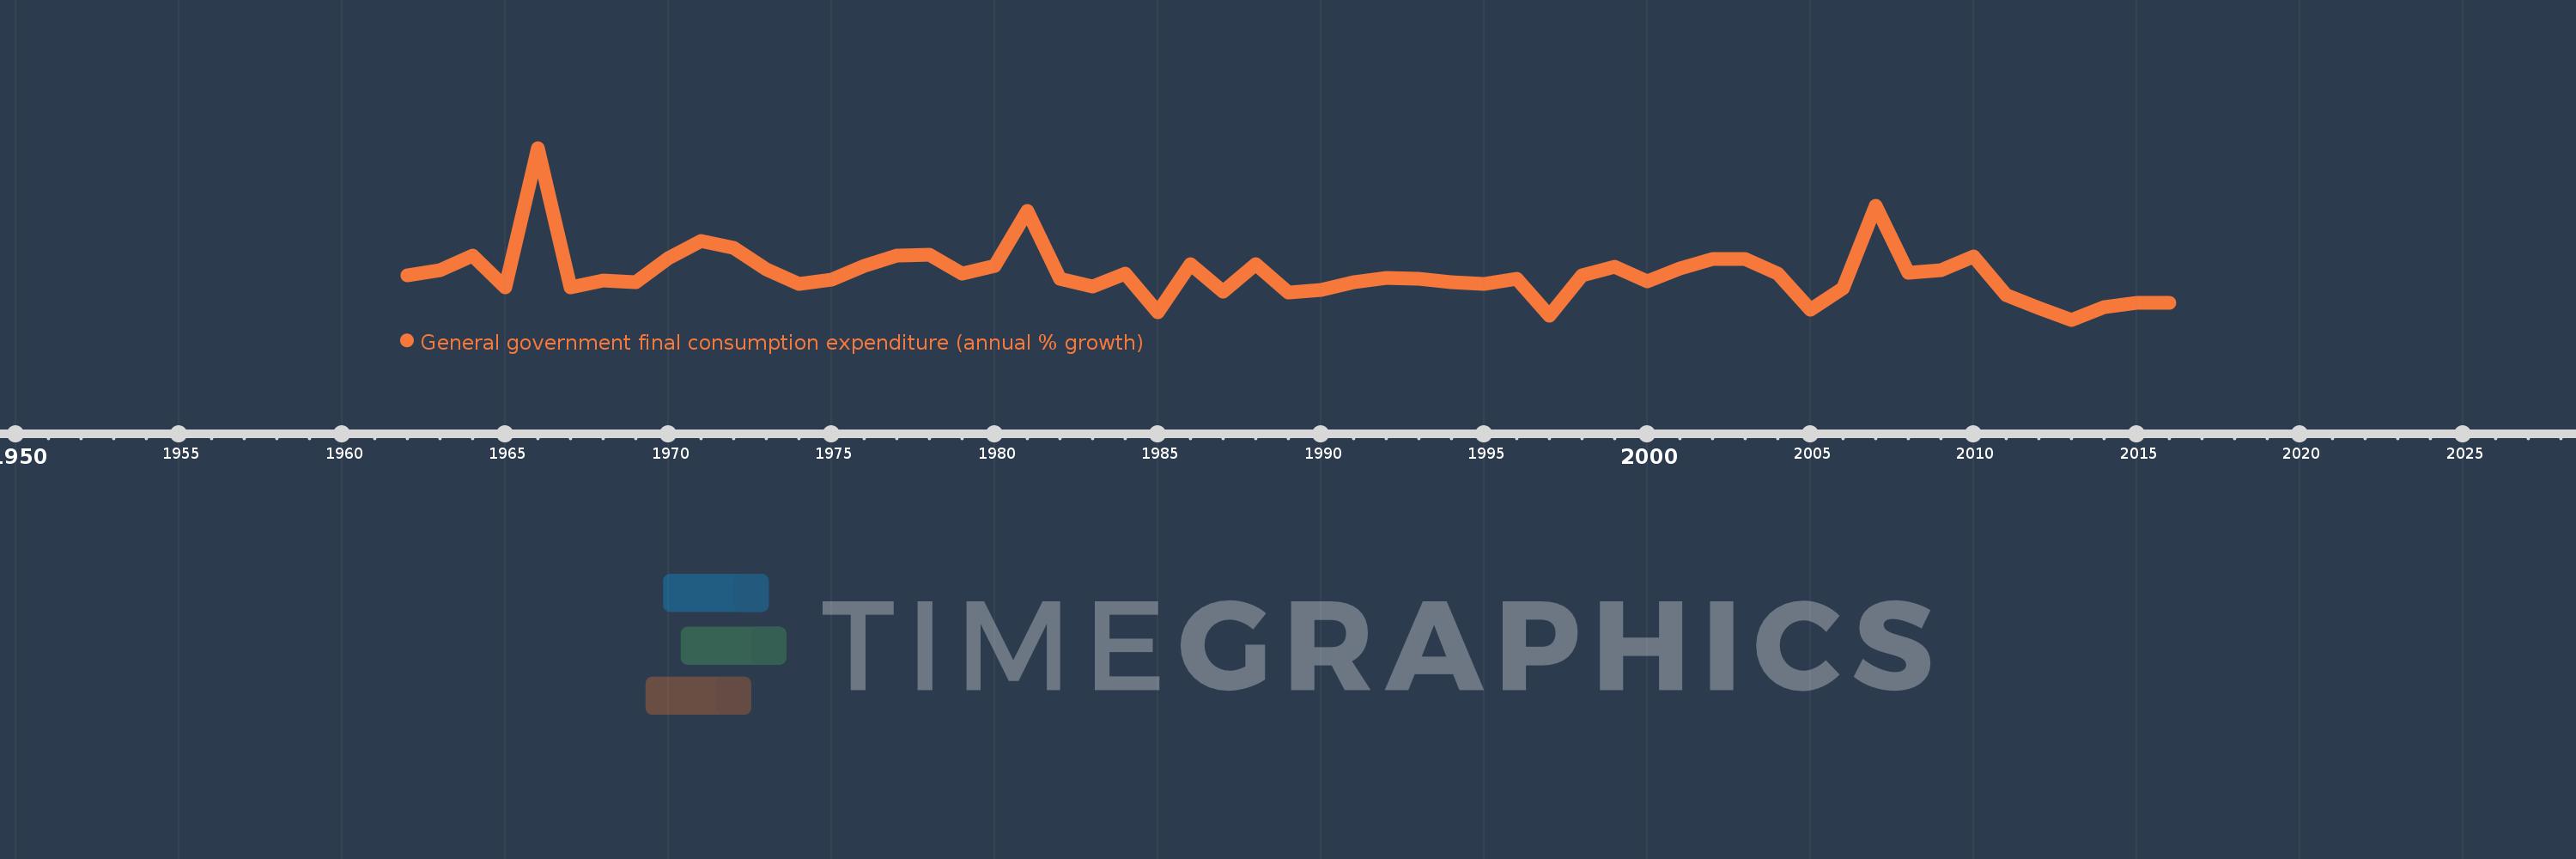
General government final consumption expenditure (annual % growth)
2016,2015,2014,2013,2012,2011,2010,2009,2008,2007,2006,2005,2004,2003,2002,2001,2000,1999,1998,1997,1996,1995,1994,1993,1992,1991,1990,1989,1988,1987,1986,1985,1984,1983,1982,1981,1980,1979,1978,1977,1976,1975,1974,1973,1972,1971,1970,1969,1968,1967,1966,1965,1964,1963,1962
Queste statistiche in altri paesi:
AlbaniaAlgeriaAntigua and BarbudaArab WorldArgentinaArmeniaAustraliaAustriaAzerbaijanBahamas, TheBahrainBangladeshBarbadosBelarusBelgiumBelizeBeninBhutanBoliviaBosnia and HerzegovinaBotswanaBrazilBrunei DarussalamBulgariaBurkina FasoBurundiCabo VerdeCambodiaCameroonCanadaCaribbean small statesCentral Europe and the BalticsChadChileChinaColombiaComorosCongo, Dem. Rep.Congo, Rep.Costa RicaCote d'IvoireCroatiaCubaCyprusCzech RepublicDenmarkDjiboutiDominican RepublicEarly-demographic dividendEast Asia & PacificEast Asia & Pacific (excluding high income)East Asia & Pacific (IDA & IBRD countries)EcuadorEgypt, Arab Rep.El SalvadorEquatorial GuineaEritreaEstoniaEthiopiaEuro areaEurope & Central AsiaEurope & Central Asia (excluding high income)Europe & Central Asia (IDA & IBRD countries)European UnionFijiFinlandFranceGabonGambia, TheGeorgiaGermanyGhanaGreeceGuatemalaGuineaGuinea-BissauHaitiHeavily indebted poor countries (HIPC)High incomeHondurasHong Kong SAR, ChinaHungaryIBRD onlyIcelandIDA & IBRD totalIDA blendIDA onlyIDA totalIndiaIndonesiaIran, Islamic Rep.IrelandIsraelItalyJamaicaJapanJordanKazakhstanKenyaKorea, Rep.KosovoKuwaitKyrgyz RepublicLao PDRLate-demographic dividendLatin America & Caribbean Latin America & Caribbean (excluding high income)Latin America & the Caribbean (IDA & IBRD countries)LatviaLebanonLiberiaLithuaniaLow & middle incomeLow incomeLower middle incomeLuxembourgMacao SAR, ChinaMacedonia, FYRMadagascarMalawiMalaysiaMaliMaltaMauritaniaMauritiusMexicoMiddle East & North AfricaMiddle East & North Africa (excluding high income)Middle East & North Africa (IDA & IBRD countries)Middle incomeMoldovaMongoliaMontenegroMoroccoMozambiqueNamibiaNepalNetherlandsNew ZealandNicaraguaNigerNigeriaNorth AmericaNorwayOECD membersOmanOther small statesPakistanPanamaPapua New GuineaParaguayPeruPhilippinesPolandPortugalPost-demographic dividendPuerto RicoQatarRomaniaRussian FederationRwandaSaudi ArabiaSenegalSerbiaSeychellesSierra LeoneSingaporeSlovak RepublicSloveniaSmall statesSomaliaSouth AfricaSouth AsiaSouth Asia (IDA & IBRD)South SudanSpainSri LankaSub-Saharan Africa Sub-Saharan Africa (excluding high income)Sub-Saharan Africa (IDA & IBRD countries)SudanSurinameSwazilandSwedenSwitzerlandSyrian Arab RepublicTajikistanTanzaniaThailandTimor-LesteTogoTrinidad and TobagoTunisiaTurkeyTurkmenistanUgandaUkraineUnited Arab EmiratesUnited KingdomUnited StatesUpper middle incomeUruguayVanuatuVenezuela, RBVietnamWest Bank and GazaWorldZimbabwe Linea del tempo:
Questa scala temporale mostra un grafico dal 1962 anno al 2016 anno. Netherlands. I dati fino ad 1961 anno non disponibili. Il numero di osservazioni attuali secondo i date: 55.
La fonte (nome):
Indicatori dello sviluppo mondiale
La fonte (organizzazione):
World Bank national accounts data, and OECD National Accounts data files.
Categorie:
Economy & Growth
sono stati aggiornati
23 apr 2017 anni
Indicatori delle variazioni dei valori per anni
Minima:
-1.313
1 gen 2013 anni
Massimo:
14.777
1 gen 1966 anni
Alla data di osservazione
Valore
Variazione assoluta
La variazione rispetto al valore precedente
1 gen 1962 anni
2.83
+2.83
0.0%
1 gen 1963 anni
3.332
+0.503
17.76%
1 gen 1964 anni
4.723
+1.391
41.73%
1 gen 1965 anni
1.72
-3.003
-63.59%
1 gen 1966 anni
14.777
+13.057
759.16%
1 gen 1967 anni
1.731
-13.045
-88.28%
1 gen 1968 anni
2.385
+0.654
37.76%
1 gen 1969 anni
2.197
-0.188
-7.86%
1 gen 1970 anni
4.494
+2.297
104.52%
1 gen 1971 anni
6.038
+1.544
34.36%
1 gen 1972 anni
5.405
-0.633
-10.48%
1 gen 1973 anni
3.426
-1.979
-36.62%
1 gen 1974 anni
2.066
-1.359
-39.68%
1 gen 1975 anni
2.463
+0.397
19.21%
1 gen 1976 anni
3.715
+1.252
50.81%
1 gen 1977 anni
4.661
+0.946
25.47%
1 gen 1978 anni
4.816
+0.155
3.32%
1 gen 1979 anni
3.009
-1.807
-37.52%
1 gen 1980 anni
3.739
+0.73
24.26%
1 gen 1981 anni
8.901
+5.162
138.05%
1 gen 1982 anni
2.493
-6.408
-72.0%
1 gen 1983 anni
1.789
-0.703
-28.21%
1 gen 1984 anni
3.028
+1.239
69.21%
1 gen 1985 anni
-0.631
-3.659
-120.84%
1 gen 1986 anni
3.911
+4.542
-719.84%
1 gen 1987 anni
1.349
-2.563
-65.52%
1 gen 1988 anni
3.924
+2.575
190.92%
1 gen 1989 anni
1.209
-2.715
-69.19%
1 gen 1990 anni
1.493
+0.284
23.53%
1 gen 1991 anni
2.232
+0.739
49.47%
1 gen 1992 anni
2.587
+0.355
15.92%
1 gen 1993 anni
2.546
-0.041
-1.6%
1 gen 1994 anni
2.175
-0.371
-14.57%
1 gen 1995 anni
2.047
-0.128
-5.87%
1 gen 1996 anni
2.508
+0.461
22.51%
1 gen 1997 anni
-0.907
-3.415
-136.15%
1 gen 1998 anni
2.868
+3.774
-416.27%
1 gen 1999 anni
3.678
+0.811
28.27%
1 gen 2000 anni
2.243
-1.436
-39.03%
1 gen 2001 anni
3.528
+1.285
57.3%
1 gen 2002 anni
4.383
+0.856
24.26%
1 gen 2003 anni
4.411
+0.027
0.62%
1 gen 2004 anni
2.991
-1.42
-32.19%
1 gen 2005 anni
-0.4
-3.391
-113.38%
1 gen 2006 anni
1.62
+2.02
-504.7%
1 gen 2007 anni
9.342
+7.722
476.63%
1 gen 2008 anni
3.104
-6.238
-66.77%
1 gen 2009 anni
3.306
+0.202
6.49%
1 gen 2010 anni
4.656
+1.351
40.86%
1 gen 2011 anni
1.022
-3.635
-78.06%
1 gen 2012 anni
-0.248
-1.269
-124.23%
1 gen 2013 anni
-1.313
-1.065
430.19%
1 gen 2014 anni
-0.105
+1.207
-91.97%
1 gen 2015 anni
0.256
+0.361
-343.03%
1 gen 2016 anni
0.238
-0.018
-7.14%
Classificazione dei paesi secondo i statistiche attuali per anni


Commenti: