29
/it/
it
AIzaSyAYiBZKx7MnpbEhh9jyipgxe19OcubqV5w
April 1, 2024
201581
Morocco
MAR
true
2
1
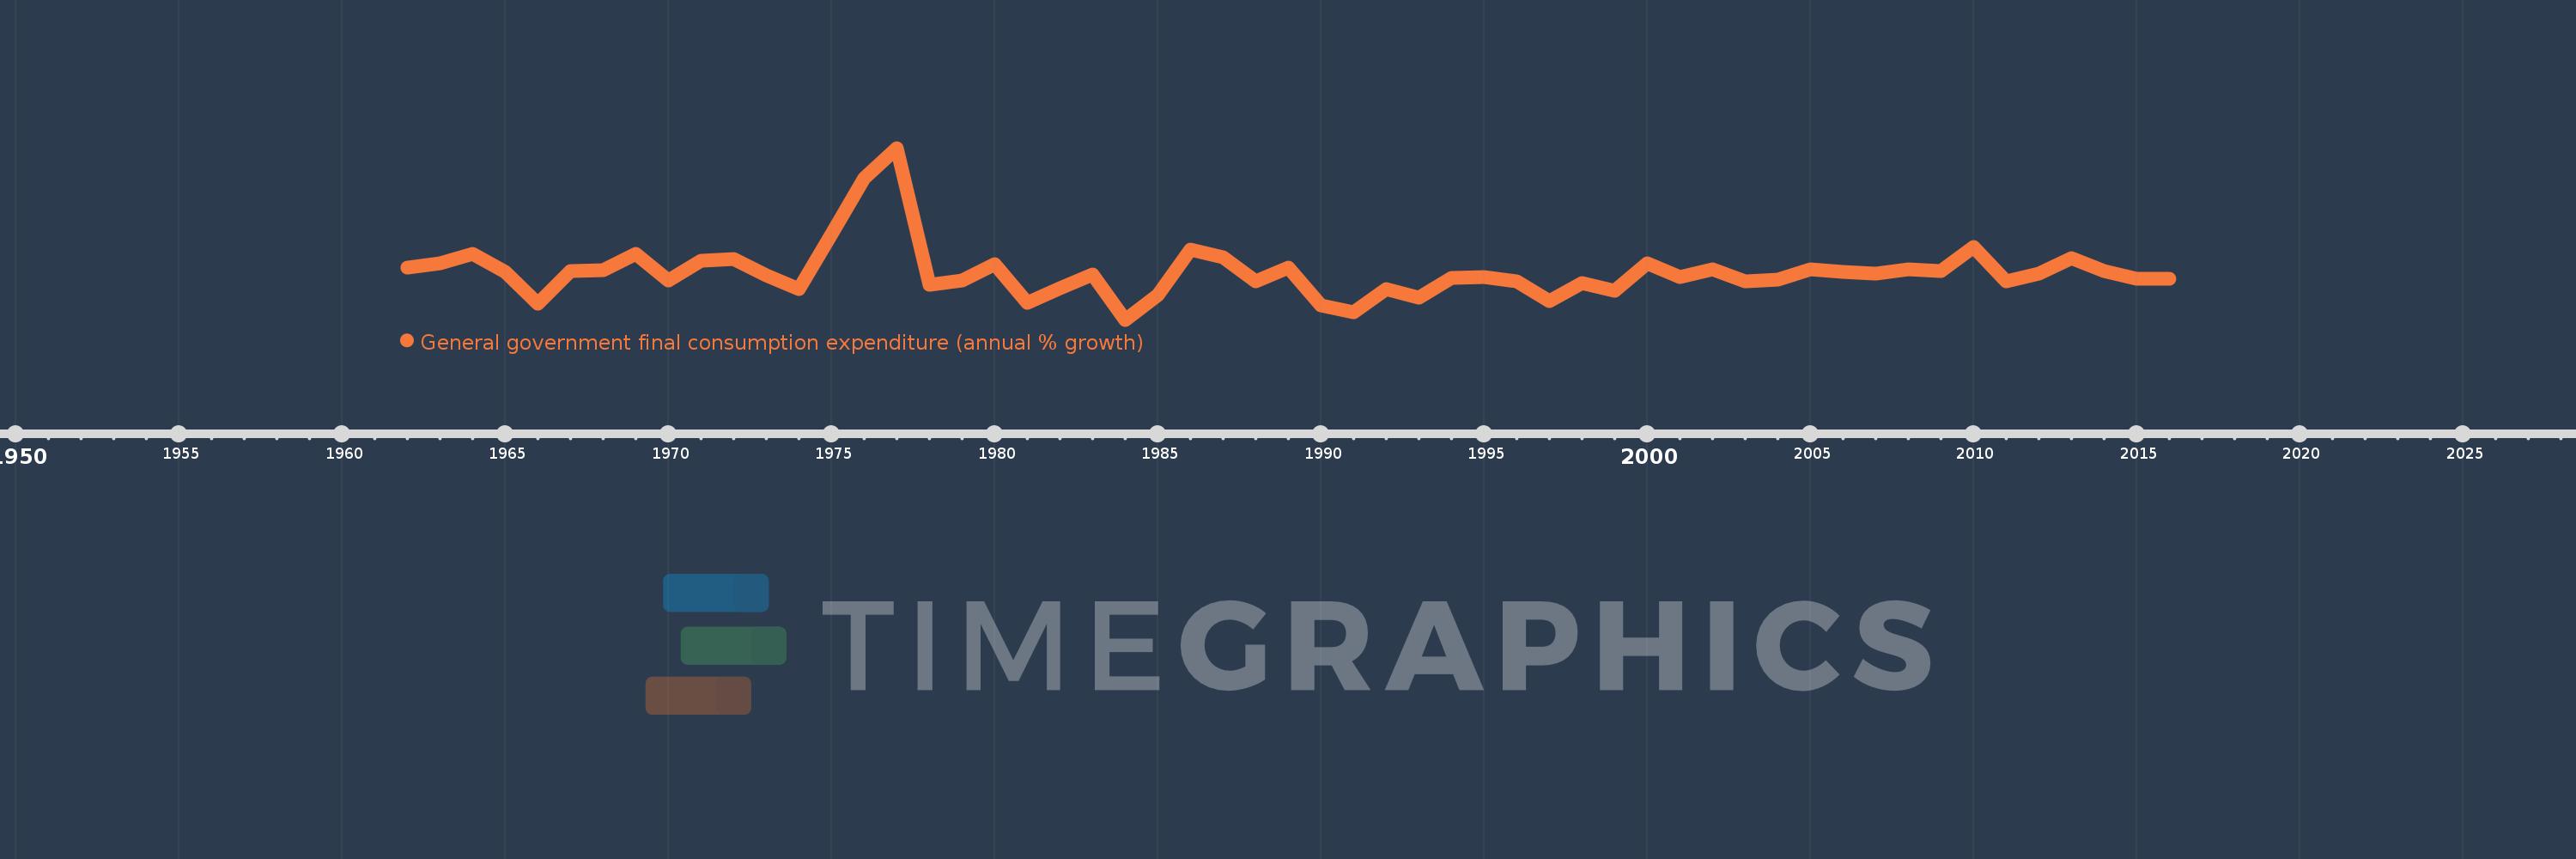
General government final consumption expenditure (annual % growth)
2016,2015,2014,2013,2012,2011,2010,2009,2008,2007,2006,2005,2004,2003,2002,2001,2000,1999,1998,1997,1996,1995,1994,1993,1992,1991,1990,1989,1988,1987,1986,1985,1984,1983,1982,1981,1980,1979,1978,1977,1976,1975,1974,1973,1972,1971,1970,1969,1968,1967,1966,1965,1964,1963,1962
Queste statistiche in altri paesi:
AlbaniaAlgeriaAntigua and BarbudaArab WorldArgentinaArmeniaAustraliaAustriaAzerbaijanBahamas, TheBahrainBangladeshBarbadosBelarusBelgiumBelizeBeninBhutanBoliviaBosnia and HerzegovinaBotswanaBrazilBrunei DarussalamBulgariaBurkina FasoBurundiCabo VerdeCambodiaCameroonCanadaCaribbean small statesCentral Europe and the BalticsChadChileChinaColombiaComorosCongo, Dem. Rep.Congo, Rep.Costa RicaCote d'IvoireCroatiaCubaCyprusCzech RepublicDenmarkDjiboutiDominican RepublicEarly-demographic dividendEast Asia & PacificEast Asia & Pacific (excluding high income)East Asia & Pacific (IDA & IBRD countries)EcuadorEgypt, Arab Rep.El SalvadorEquatorial GuineaEritreaEstoniaEthiopiaEuro areaEurope & Central AsiaEurope & Central Asia (excluding high income)Europe & Central Asia (IDA & IBRD countries)European UnionFijiFinlandFranceGabonGambia, TheGeorgiaGermanyGhanaGreeceGuatemalaGuineaGuinea-BissauHaitiHeavily indebted poor countries (HIPC)High incomeHondurasHong Kong SAR, ChinaHungaryIBRD onlyIcelandIDA & IBRD totalIDA blendIDA onlyIDA totalIndiaIndonesiaIran, Islamic Rep.IrelandIsraelItalyJamaicaJapanJordanKazakhstanKenyaKorea, Rep.KosovoKuwaitKyrgyz RepublicLao PDRLate-demographic dividendLatin America & Caribbean Latin America & Caribbean (excluding high income)Latin America & the Caribbean (IDA & IBRD countries)LatviaLebanonLiberiaLithuaniaLow & middle incomeLow incomeLower middle incomeLuxembourgMacao SAR, ChinaMacedonia, FYRMadagascarMalawiMalaysiaMaliMaltaMauritaniaMauritiusMexicoMiddle East & North AfricaMiddle East & North Africa (excluding high income)Middle East & North Africa (IDA & IBRD countries)Middle incomeMoldovaMongoliaMontenegroMoroccoMozambiqueNamibiaNepalNetherlandsNew ZealandNicaraguaNigerNigeriaNorth AmericaNorwayOECD membersOmanOther small statesPakistanPanamaPapua New GuineaParaguayPeruPhilippinesPolandPortugalPost-demographic dividendPuerto RicoQatarRomaniaRussian FederationRwandaSaudi ArabiaSenegalSerbiaSeychellesSierra LeoneSingaporeSlovak RepublicSloveniaSmall statesSomaliaSouth AfricaSouth AsiaSouth Asia (IDA & IBRD)South SudanSpainSri LankaSub-Saharan Africa Sub-Saharan Africa (excluding high income)Sub-Saharan Africa (IDA & IBRD countries)SudanSurinameSwazilandSwedenSwitzerlandSyrian Arab RepublicTajikistanTanzaniaThailandTimor-LesteTogoTrinidad and TobagoTunisiaTurkeyTurkmenistanUgandaUkraineUnited Arab EmiratesUnited KingdomUnited StatesUpper middle incomeUruguayVanuatuVenezuela, RBVietnamWest Bank and GazaWorldZimbabwe Linea del tempo:
Questa scala temporale mostra un grafico dal 1962 anno al 2016 anno. Morocco. I dati fino ad 1961 anno non disponibili. Il numero di osservazioni attuali secondo i date: 55.
La fonte (nome):
Indicatori dello sviluppo mondiale
La fonte (organizzazione):
World Bank national accounts data, and OECD National Accounts data files.
Categorie:
Economy & Growth
sono stati aggiornati
23 apr 2017 anni
Indicatori delle variazioni dei valori per anni
Minima:
-11.577
1 gen 1984 anni
Massimo:
44.345
1 gen 1977 anni
Alla data di osservazione
Valore
Variazione assoluta
La variazione rispetto al valore precedente
1 gen 1962 anni
5.394
+5.394
0.0%
1 gen 1963 anni
6.676
+1.282
23.76%
1 gen 1964 anni
9.964
+3.288
49.25%
1 gen 1965 anni
4.034
-5.93
-59.52%
1 gen 1966 anni
-6.373
-10.406
-257.98%
1 gen 1967 anni
4.366
+10.738
-168.51%
1 gen 1968 anni
4.607
+0.242
5.54%
1 gen 1969 anni
9.893
+5.286
114.72%
1 gen 1970 anni
1.193
-8.7
-87.94%
1 gen 1971 anni
7.609
+6.415
537.53%
1 gen 1972 anni
8.124
+0.515
6.77%
1 gen 1973 anni
2.899
-5.225
-64.31%
1 gen 1974 anni
-1.561
-4.46
-153.86%
1 gen 1975 anni
16.274
+17.836
-1.14 Mille.%
1 gen 1976 anni
34.566
+18.292
112.39%
1 gen 1977 anni
44.345
+9.779
28.29%
1 gen 1978 anni
-0.077
-44.422
-100.17%
1 gen 1979 anni
1.205
+1.281
-1.67 Mille.%
1 gen 1980 anni
6.48
+5.276
437.91%
1 gen 1981 anni
-6.11
-12.59
-194.29%
1 gen 1982 anni
-1.428
+4.682
-76.62%
1 gen 1983 anni
3.084
+4.512
-315.86%
1 gen 1984 anni
-11.577
-14.661
-475.45%
1 gen 1985 anni
-3.578
+8.0
-69.1%
1 gen 1986 anni
11.2
+14.778
-413.03%
1 gen 1987 anni
8.636
-2.564
-22.89%
1 gen 1988 anni
0.883
-7.753
-89.78%
1 gen 1989 anni
5.445
+4.562
516.78%
1 gen 1990 anni
-6.806
-12.251
-224.98%
1 gen 1991 anni
-9.102
-2.296
33.74%
1 gen 1992 anni
-1.535
+7.566
-83.13%
1 gen 1993 anni
-4.391
-2.856
186.0%
1 gen 1994 anni
2.16
+6.551
-149.19%
1 gen 1995 anni
2.209
+0.049
2.26%
1 gen 1996 anni
0.954
-1.255
-56.79%
1 gen 1997 anni
-5.556
-6.51
-682.1%
1 gen 1998 anni
0.333
+5.888
-105.99%
1 gen 1999 anni
-2.244
-2.577
-774.35%
1 gen 2000 anni
6.805
+9.049
-403.25%
1 gen 2001 anni
2.251
-4.554
-66.92%
1 gen 2002 anni
4.868
+2.617
116.28%
1 gen 2003 anni
0.994
-3.874
-79.58%
1 gen 2004 anni
1.467
+0.473
47.56%
1 gen 2005 anni
4.713
+3.246
221.27%
1 gen 2006 anni
3.967
-0.746
-15.83%
1 gen 2007 anni
3.383
-0.584
-14.72%
1 gen 2008 anni
4.922
+1.539
45.49%
1 gen 2009 anni
4.236
-0.686
-13.93%
1 gen 2010 anni
12.189
+7.953
187.76%
1 gen 2011 anni
0.919
-11.27
-92.46%
1 gen 2012 anni
3.362
+2.443
265.8%
1 gen 2013 anni
8.452
+5.09
151.37%
1 gen 2014 anni
4.202
-4.25
-50.28%
1 gen 2015 anni
1.825
-2.377
-56.56%
1 gen 2016 anni
1.888
+0.062
3.4%
Classificazione dei paesi secondo i statistiche attuali per anni


Commenti: