29
/it/
it
AIzaSyAYiBZKx7MnpbEhh9jyipgxe19OcubqV5w
April 1, 2024
97694
Cabo Verde
CPV
true
2
1
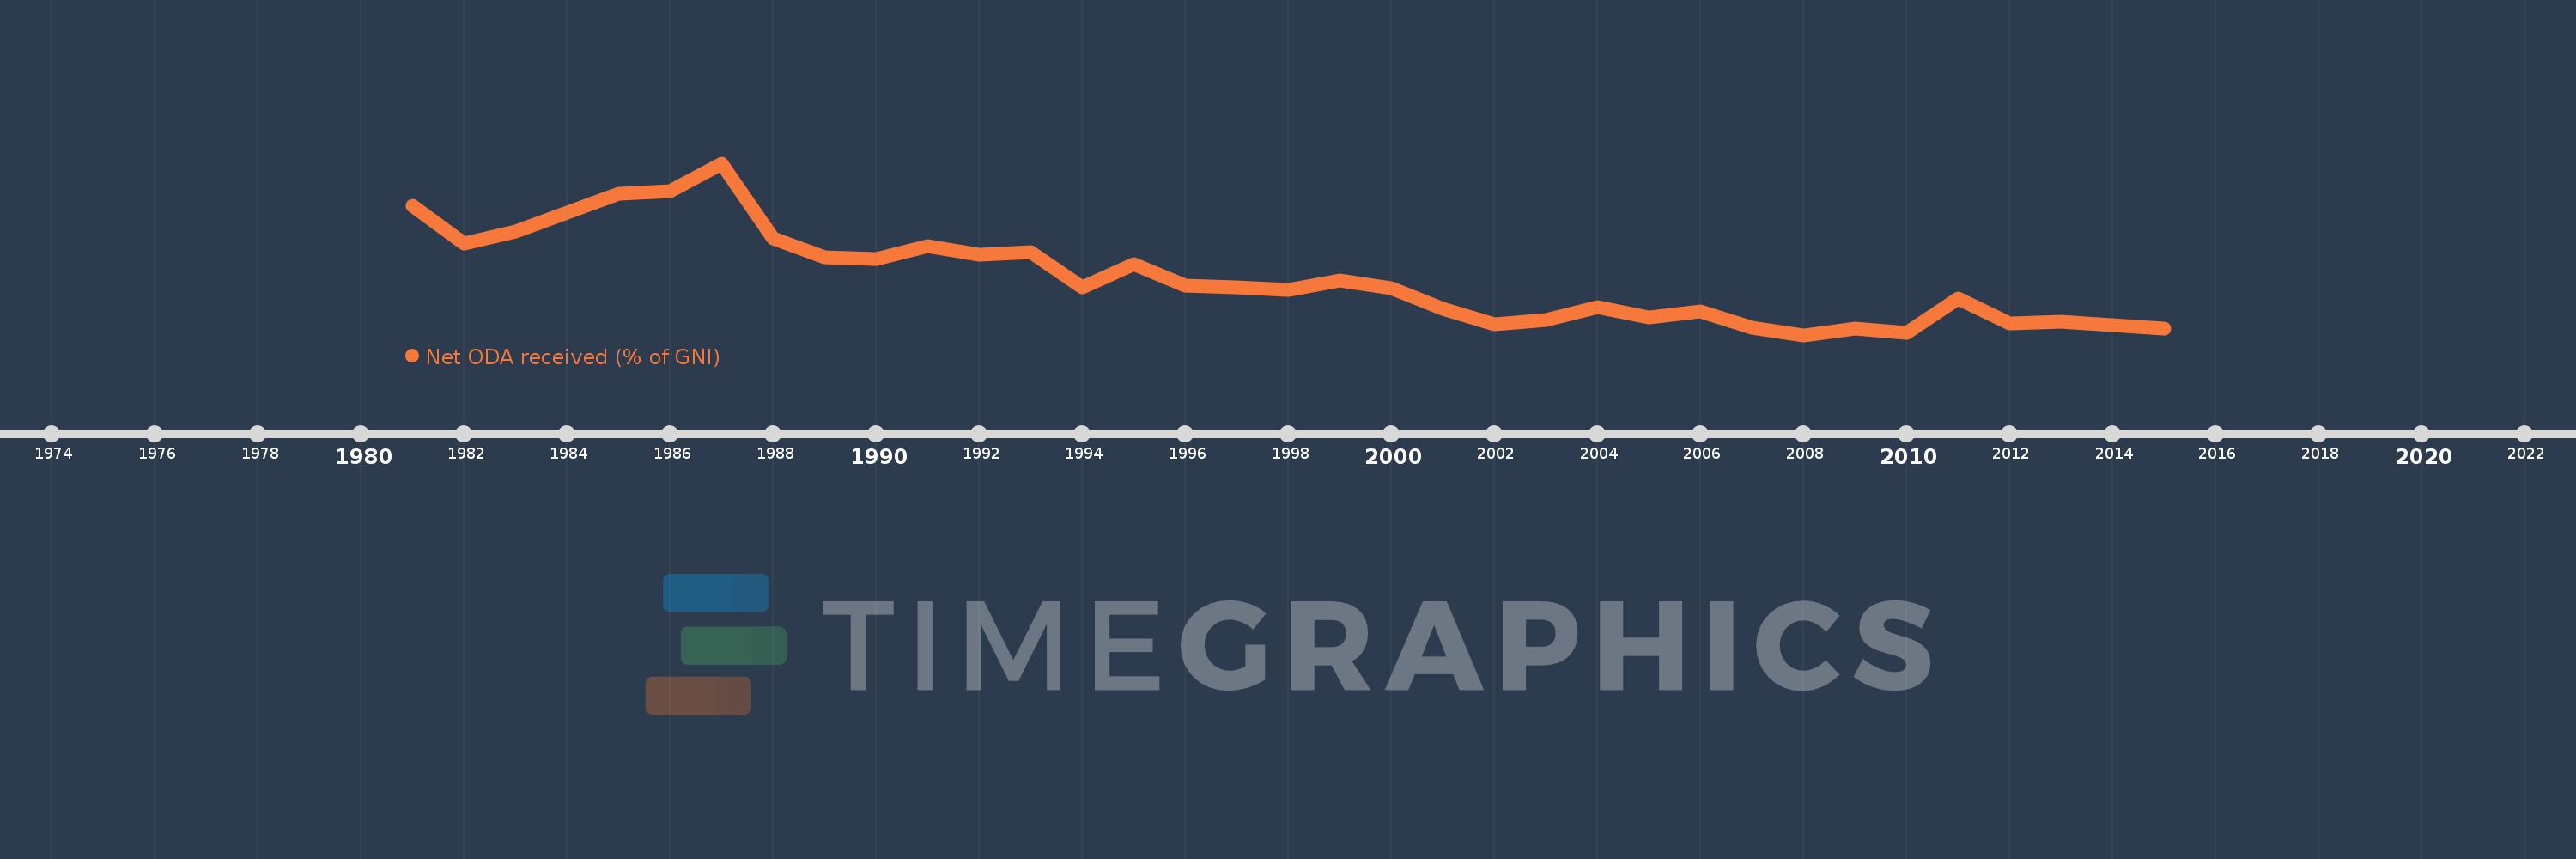
Net ODA received (% of GNI)
2015,2014,2013,2012,2011,2010,2009,2008,2007,2006,2005,2004,2003,2002,2001,2000,1999,1998,1997,1996,1995,1994,1993,1992,1991,1990,1989,1988,1987,1986,1985,1984,1983,1982,1981
Queste statistiche in altri paesi:
AfghanistanAlbaniaAlgeriaAngolaAntigua and BarbudaArab WorldArgentinaArmeniaAzerbaijanBahamas, TheBahrainBangladeshBarbadosBelarusBelizeBeninBermudaBhutanBoliviaBosnia and HerzegovinaBotswanaBrazilBrunei DarussalamBurkina FasoBurundiCabo VerdeCambodiaCameroonCaribbean small statesCentral African RepublicCentral Europe and the BalticsChadChileChinaColombiaComorosCongo, Dem. Rep.Congo, Rep.Costa RicaCote d'IvoireCroatiaCubaCyprusDjiboutiDominicaDominican RepublicEast Asia & PacificEast Asia & Pacific (excluding high income)East Asia & Pacific (IDA & IBRD countries)EcuadorEgypt, Arab Rep.El SalvadorEquatorial GuineaEritreaEthiopiaEuro areaEurope & Central AsiaEurope & Central Asia (excluding high income)Europe & Central Asia (IDA & IBRD countries)European UnionFijiFragile and conflict affected situationsFrench PolynesiaGabonGambia, TheGeorgiaGhanaGrenadaGuatemalaGuineaGuinea-BissauGuyanaHaitiHeavily indebted poor countries (HIPC)High incomeHondurasHong Kong SAR, ChinaIBRD onlyIDA & IBRD totalIDA blendIDA onlyIDA totalIndiaIndonesiaIran, Islamic Rep.IraqIsraelJamaicaJordanKazakhstanKenyaKiribatiKorea, Rep.KosovoKuwaitKyrgyz RepublicLao PDRLatin America & Caribbean Latin America & Caribbean (excluding high income)Latin America & the Caribbean (IDA & IBRD countries)Least developed countries: UN classificationLebanonLesothoLiberiaLibyaLow & middle incomeLow incomeLower middle incomeMacao SAR, ChinaMacedonia, FYRMadagascarMalawiMalaysiaMaldivesMaliMaltaMarshall IslandsMauritaniaMauritiusMexicoMicronesia, Fed. Sts.Middle East & North AfricaMiddle East & North Africa (excluding high income)Middle East & North Africa (IDA & IBRD countries)Middle incomeMoldovaMongoliaMontenegroMoroccoMozambiqueMyanmarNamibiaNauruNepalNew CaledoniaNicaraguaNigerNigeriaNorth AmericaOECD membersOmanOther small statesPacific island small statesPakistanPalauPanamaPapua New GuineaParaguayPeruPhilippinesQatarRwandaSamoaSao Tome and PrincipeSaudi ArabiaSenegalSerbiaSeychellesSierra LeoneSingaporeSloveniaSmall statesSolomon IslandsSomaliaSouth AfricaSouth AsiaSouth Asia (IDA & IBRD)South SudanSri LankaSt. Kitts and NevisSt. LuciaSt. Vincent and the GrenadinesSub-Saharan Africa Sub-Saharan Africa (excluding high income)Sub-Saharan Africa (IDA & IBRD countries)SudanSurinameSwazilandSyrian Arab RepublicTajikistanTanzaniaThailandTimor-LesteTogoTongaTrinidad and TobagoTunisiaTurkeyTurkmenistanTuvaluUgandaUkraineUpper middle incomeUruguayUzbekistanVanuatuVenezuela, RBVietnamWest Bank and GazaWorldYemen, Rep.ZambiaZimbabwe Linea del tempo:
Questa scala temporale mostra un grafico dal 1981 anno al 2015 anno. Cabo Verde. I dati fino ad 1980 anno non disponibili. Il numero di osservazioni attuali secondo i date: 35.
La fonte (nome):
Indicatori dello sviluppo mondiale
La fonte (organizzazione):
Development Assistance Committee of the Organisation for Economic Co-operation and Development, Geographical Distribution of Financial Flows to Developing Countries, Development Co-operation Report, and International Development Statistics database. Data are available online at: www.oecd.org/dac/stats/idsonline. World Bank GNI estimates are used for the denominator.
Categorie:
Aid Effectiveness, Economy & Growth, External Debt
sono stati aggiornati
23 apr 2017 anni
Indicatori delle variazioni dei valori per anni
Minima:
11.141
1 gen 2008 anni
Massimo:
55.374
1 gen 1987 anni
Alla data di osservazione
Valore
Variazione assoluta
La variazione rispetto al valore precedente
1 gen 1981 anni
44.535
+44.535
0.0%
1 gen 1982 anni
34.781
-9.755
-21.9%
1 gen 1983 anni
37.743
+2.962
8.52%
1 gen 1984 anni
42.697
+4.954
13.13%
1 gen 1985 anni
47.521
+4.824
11.3%
1 gen 1986 anni
48.117
+0.597
1.26%
1 gen 1987 anni
55.374
+7.256
15.08%
1 gen 1988 anni
35.936
-19.438
-35.1%
1 gen 1989 anni
31.084
-4.852
-13.5%
1 gen 1990 anni
30.657
-0.427
-1.37%
1 gen 1991 anni
34.052
+3.394
11.07%
1 gen 1992 anni
31.773
-2.278
-6.69%
1 gen 1993 anni
32.496
+0.723
2.28%
1 gen 1994 anni
23.395
-9.101
-28.01%
1 gen 1995 anni
29.458
+6.063
25.91%
1 gen 1996 anni
23.883
-5.575
-18.93%
1 gen 1997 anni
23.405
-0.477
-2.0%
1 gen 1998 anni
22.757
-0.649
-2.77%
1 gen 1999 anni
25.096
+2.339
10.28%
1 gen 2000 anni
23.241
-1.855
-7.39%
1 gen 2001 anni
17.844
-5.397
-23.22%
1 gen 2002 anni
13.861
-3.983
-22.32%
1 gen 2003 anni
15.096
+1.235
8.91%
1 gen 2004 anni
18.415
+3.319
21.99%
1 gen 2005 anni
15.781
-2.634
-14.3%
1 gen 2006 anni
17.288
+1.507
9.55%
1 gen 2007 anni
13.026
-4.262
-24.65%
1 gen 2008 anni
11.141
-1.885
-14.47%
1 gen 2009 anni
12.73
+1.589
14.26%
1 gen 2010 anni
11.723
-1.006
-7.9%
1 gen 2011 anni
20.583
+8.859
75.57%
1 gen 2012 anni
14.043
-6.539
-31.77%
1 gen 2013 anni
14.644
+0.6
4.27%
1 gen 2014 anni
13.699
-0.945
-6.45%
1 gen 2015 anni
12.858
-0.841
-6.14%
Classificazione dei paesi secondo i statistiche attuali per anni


Commenti: