29
/it/
it
AIzaSyAYiBZKx7MnpbEhh9jyipgxe19OcubqV5w
April 1, 2024
61033
Sub-Saharan Africa (IDA & IBRD countries)
TSS
false
2
1
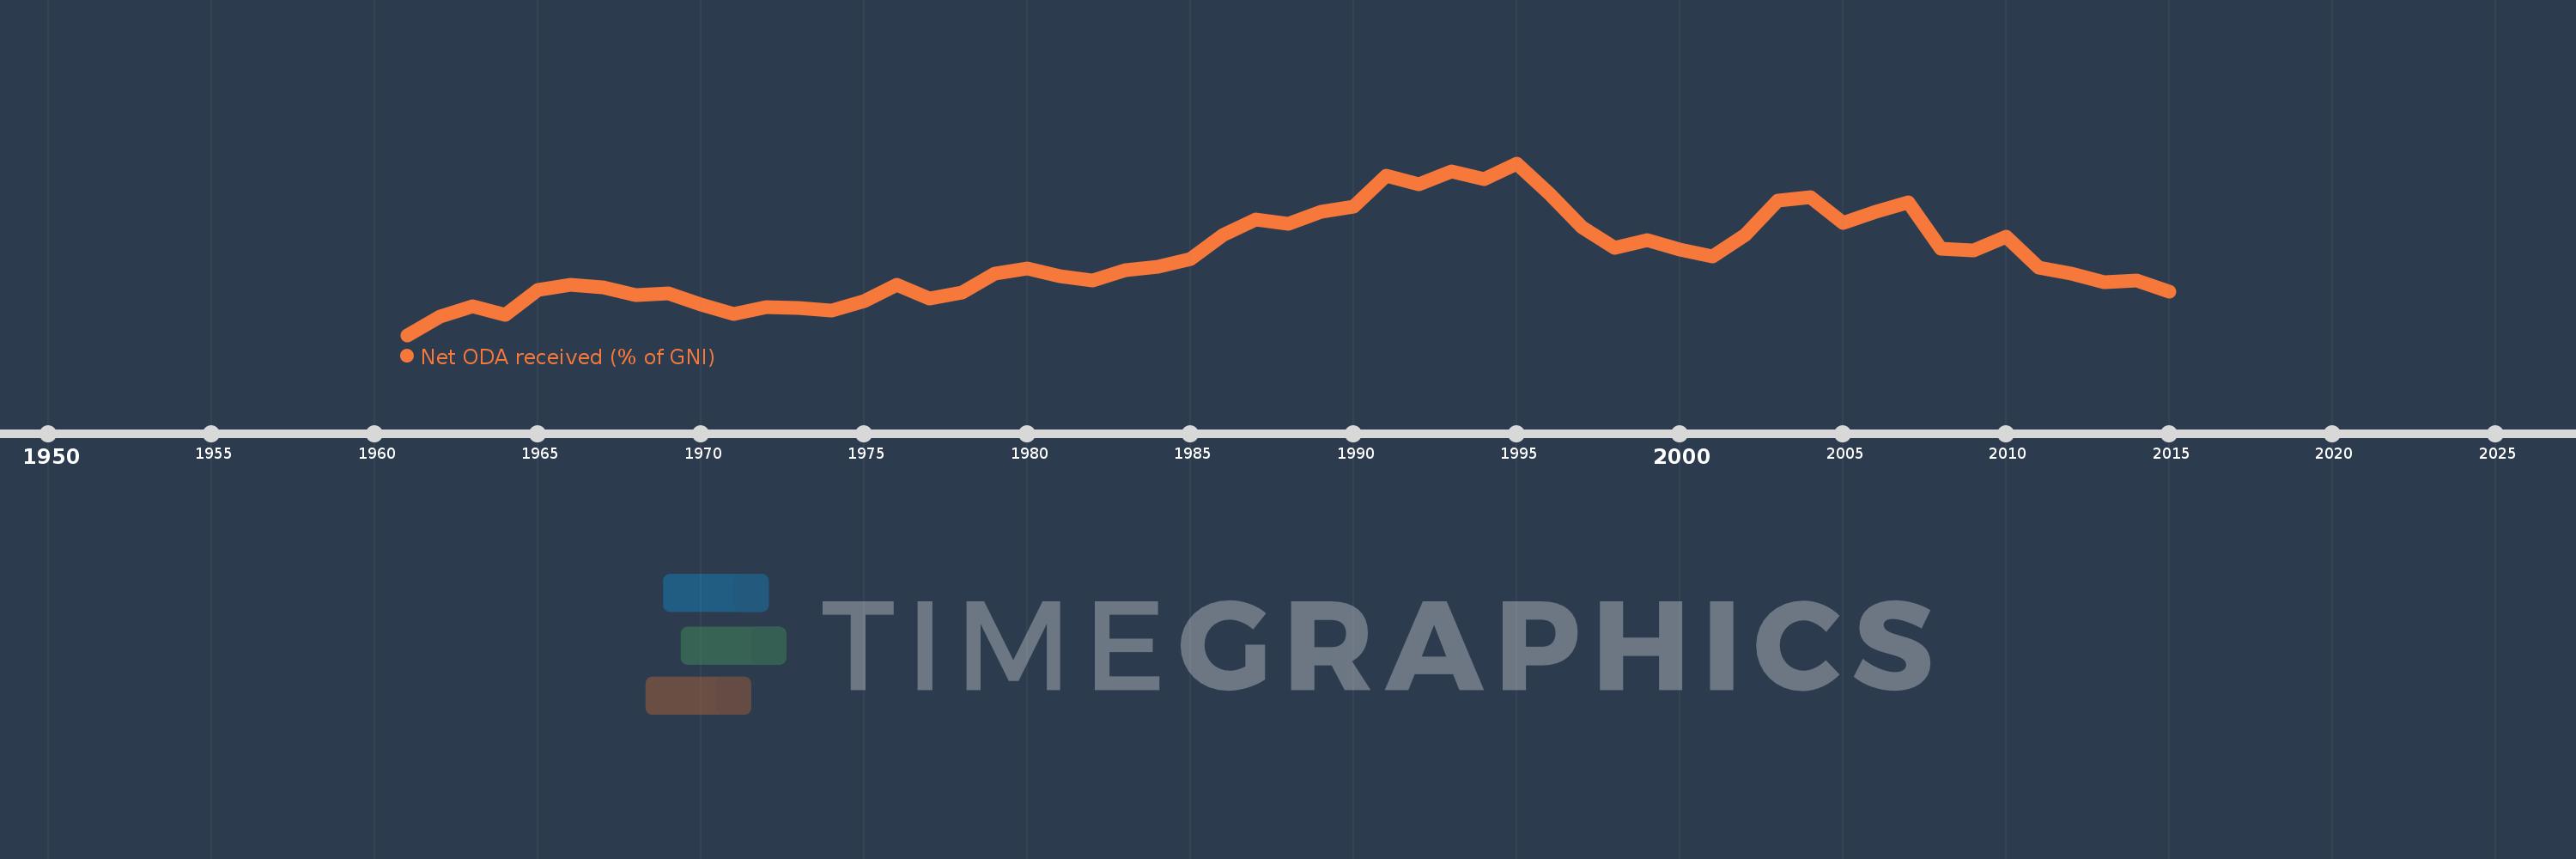
Net ODA received (% of GNI)
2015,2014,2013,2012,2011,2010,2009,2008,2007,2006,2005,2004,2003,2002,2001,2000,1999,1998,1997,1996,1995,1994,1993,1992,1991,1990,1989,1988,1987,1986,1985,1984,1983,1982,1981,1980,1979,1978,1977,1976,1975,1974,1973,1972,1971,1970,1969,1968,1967,1966,1965,1964,1963,1962,1961
Queste statistiche in altri paesi:
AfghanistanAlbaniaAlgeriaAngolaAntigua and BarbudaArab WorldArgentinaArmeniaAzerbaijanBahamas, TheBahrainBangladeshBarbadosBelarusBelizeBeninBermudaBhutanBoliviaBosnia and HerzegovinaBotswanaBrazilBrunei DarussalamBurkina FasoBurundiCabo VerdeCambodiaCameroonCaribbean small statesCentral African RepublicCentral Europe and the BalticsChadChileChinaColombiaComorosCongo, Dem. Rep.Congo, Rep.Costa RicaCote d'IvoireCroatiaCubaCyprusDjiboutiDominicaDominican RepublicEast Asia & PacificEast Asia & Pacific (excluding high income)East Asia & Pacific (IDA & IBRD countries)EcuadorEgypt, Arab Rep.El SalvadorEquatorial GuineaEritreaEthiopiaEuro areaEurope & Central AsiaEurope & Central Asia (excluding high income)Europe & Central Asia (IDA & IBRD countries)European UnionFijiFragile and conflict affected situationsFrench PolynesiaGabonGambia, TheGeorgiaGhanaGrenadaGuatemalaGuineaGuinea-BissauGuyanaHaitiHeavily indebted poor countries (HIPC)High incomeHondurasHong Kong SAR, ChinaIBRD onlyIDA & IBRD totalIDA blendIDA onlyIDA totalIndiaIndonesiaIran, Islamic Rep.IraqIsraelJamaicaJordanKazakhstanKenyaKiribatiKorea, Rep.KosovoKuwaitKyrgyz RepublicLao PDRLatin America & Caribbean Latin America & Caribbean (excluding high income)Latin America & the Caribbean (IDA & IBRD countries)Least developed countries: UN classificationLebanonLesothoLiberiaLibyaLow & middle incomeLow incomeLower middle incomeMacao SAR, ChinaMacedonia, FYRMadagascarMalawiMalaysiaMaldivesMaliMaltaMarshall IslandsMauritaniaMauritiusMexicoMicronesia, Fed. Sts.Middle East & North AfricaMiddle East & North Africa (excluding high income)Middle East & North Africa (IDA & IBRD countries)Middle incomeMoldovaMongoliaMontenegroMoroccoMozambiqueMyanmarNamibiaNauruNepalNew CaledoniaNicaraguaNigerNigeriaNorth AmericaOECD membersOmanOther small statesPacific island small statesPakistanPalauPanamaPapua New GuineaParaguayPeruPhilippinesQatarRwandaSamoaSao Tome and PrincipeSaudi ArabiaSenegalSerbiaSeychellesSierra LeoneSingaporeSloveniaSmall statesSolomon IslandsSomaliaSouth AfricaSouth AsiaSouth Asia (IDA & IBRD)South SudanSri LankaSt. Kitts and NevisSt. LuciaSt. Vincent and the GrenadinesSub-Saharan Africa Sub-Saharan Africa (excluding high income)Sub-Saharan Africa (IDA & IBRD countries)SudanSurinameSwazilandSyrian Arab RepublicTajikistanTanzaniaThailandTimor-LesteTogoTongaTrinidad and TobagoTunisiaTurkeyTurkmenistanTuvaluUgandaUkraineUpper middle incomeUruguayUzbekistanVanuatuVenezuela, RBVietnamWest Bank and GazaWorldYemen, Rep.ZambiaZimbabwe Linea del tempo:
Questa scala temporale mostra un grafico dal 1961 anno al 2015 anno. Sub-Saharan Africa (IDA & IBRD countries). I dati fino ad 1960 anno non disponibili. Il numero di osservazioni attuali secondo i date: 55.
La fonte (nome):
Indicatori dello sviluppo mondiale
La fonte (organizzazione):
Development Assistance Committee of the Organisation for Economic Co-operation and Development, Geographical Distribution of Financial Flows to Developing Countries, Development Co-operation Report, and International Development Statistics database. Data are available online at: www.oecd.org/dac/stats/idsonline. World Bank GNI estimates are used for the denominator.
Categorie:
Aid Effectiveness, Economy & Growth, External Debt
sono stati aggiornati
23 apr 2017 anni
Indicatori delle variazioni dei valori per anni
Minima:
1.102
1 gen 1961 anni
Massimo:
6.23
1 gen 1995 anni
Alla data di osservazione
Valore
Variazione assoluta
La variazione rispetto al valore precedente
1 gen 1961 anni
1.102
+1.102
0.0%
1 gen 1962 anni
1.665
+0.564
51.18%
1 gen 1963 anni
1.955
+0.289
17.38%
1 gen 1964 anni
1.716
-0.239
-12.21%
1 gen 1965 anni
2.443
+0.726
42.33%
1 gen 1966 anni
2.592
+0.15
6.13%
1 gen 1967 anni
2.518
-0.074
-2.86%
1 gen 1968 anni
2.307
-0.211
-8.39%
1 gen 1969 anni
2.358
+0.051
2.21%
1 gen 1970 anni
2.008
-0.35
-14.85%
1 gen 1971 anni
1.719
-0.288
-14.35%
1 gen 1972 anni
1.939
+0.219
12.76%
1 gen 1973 anni
1.917
-0.022
-1.13%
1 gen 1974 anni
1.835
-0.082
-4.27%
1 gen 1975 anni
2.11
+0.275
14.96%
1 gen 1976 anni
2.61
+0.5
23.71%
1 gen 1977 anni
2.2
-0.41
-15.72%
1 gen 1978 anni
2.381
+0.181
8.24%
1 gen 1979 anni
2.929
+0.548
23.02%
1 gen 1980 anni
3.088
+0.159
5.44%
1 gen 1981 anni
2.865
-0.223
-7.21%
1 gen 1982 anni
2.732
-0.134
-4.67%
1 gen 1983 anni
3.043
+0.311
11.39%
1 gen 1984 anni
3.142
+0.099
3.25%
1 gen 1985 anni
3.369
+0.227
7.23%
1 gen 1986 anni
4.09
+0.721
21.41%
1 gen 1987 anni
4.546
+0.456
11.14%
1 gen 1988 anni
4.433
-0.113
-2.49%
1 gen 1989 anni
4.787
+0.355
8.0%
1 gen 1990 anni
4.935
+0.148
3.09%
1 gen 1991 anni
5.859
+0.924
18.72%
1 gen 1992 anni
5.614
-0.245
-4.19%
1 gen 1993 anni
5.977
+0.363
6.46%
1 gen 1994 anni
5.765
-0.211
-3.53%
1 gen 1995 anni
6.23
+0.465
8.07%
1 gen 1996 anni
5.315
-0.916
-14.7%
1 gen 1997 anni
4.319
-0.996
-18.74%
1 gen 1998 anni
3.709
-0.61
-14.12%
1 gen 1999 anni
3.937
+0.228
6.15%
1 gen 2000 anni
3.65
-0.287
-7.3%
1 gen 2001 anni
3.446
-0.204
-5.58%
1 gen 2002 anni
4.08
+0.634
18.39%
1 gen 2003 anni
5.102
+1.023
25.07%
1 gen 2004 anni
5.213
+0.11
2.16%
1 gen 2005 anni
4.45
-0.763
-14.63%
1 gen 2006 anni
4.773
+0.323
7.27%
1 gen 2007 anni
5.06
+0.286
6.0%
1 gen 2008 anni
3.684
-1.375
-27.18%
1 gen 2009 anni
3.626
-0.059
-1.59%
1 gen 2010 anni
4.041
+0.416
11.46%
1 gen 2011 anni
3.11
-0.931
-23.04%
1 gen 2012 anni
2.93
-0.18
-5.79%
1 gen 2013 anni
2.685
-0.245
-8.38%
1 gen 2014 anni
2.722
+0.037
1.39%
1 gen 2015 anni
2.393
-0.329
-12.09%
Classificazione dei paesi secondo i statistiche attuali per anni


Commenti: