29
/it/
it
AIzaSyAYiBZKx7MnpbEhh9jyipgxe19OcubqV5w
April 1, 2024
79772
Barbados
BRB
true
2
1
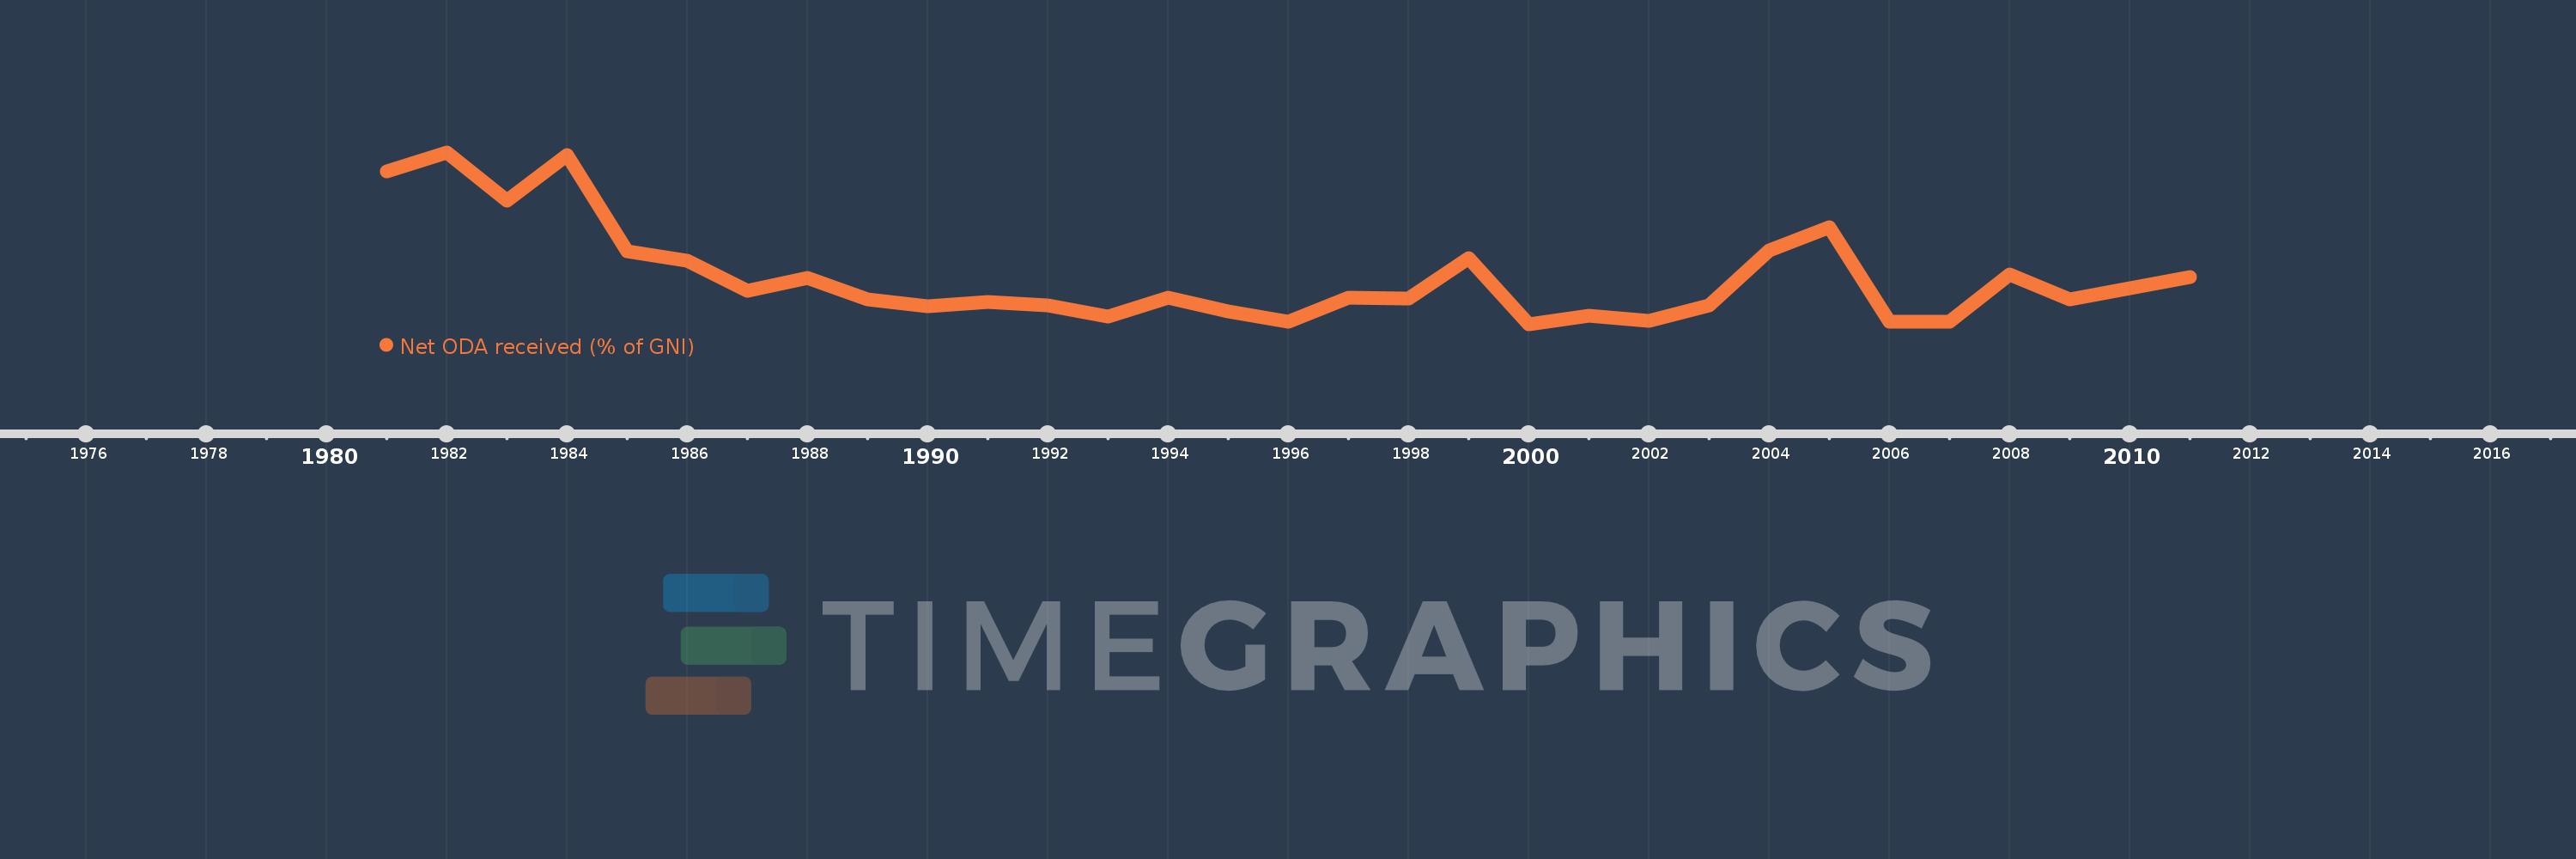
Net ODA received (% of GNI)
2011,2010,2009,2008,2007,2006,2005,2004,2003,2002,2001,2000,1999,1998,1997,1996,1995,1994,1993,1992,1991,1990,1989,1988,1987,1986,1985,1984,1983,1982,1981
Queste statistiche in altri paesi:
AfghanistanAlbaniaAlgeriaAngolaAntigua and BarbudaArab WorldArgentinaArmeniaAzerbaijanBahamas, TheBahrainBangladeshBarbadosBelarusBelizeBeninBermudaBhutanBoliviaBosnia and HerzegovinaBotswanaBrazilBrunei DarussalamBurkina FasoBurundiCabo VerdeCambodiaCameroonCaribbean small statesCentral African RepublicCentral Europe and the BalticsChadChileChinaColombiaComorosCongo, Dem. Rep.Congo, Rep.Costa RicaCote d'IvoireCroatiaCubaCyprusDjiboutiDominicaDominican RepublicEast Asia & PacificEast Asia & Pacific (excluding high income)East Asia & Pacific (IDA & IBRD countries)EcuadorEgypt, Arab Rep.El SalvadorEquatorial GuineaEritreaEthiopiaEuro areaEurope & Central AsiaEurope & Central Asia (excluding high income)Europe & Central Asia (IDA & IBRD countries)European UnionFijiFragile and conflict affected situationsFrench PolynesiaGabonGambia, TheGeorgiaGhanaGrenadaGuatemalaGuineaGuinea-BissauGuyanaHaitiHeavily indebted poor countries (HIPC)High incomeHondurasHong Kong SAR, ChinaIBRD onlyIDA & IBRD totalIDA blendIDA onlyIDA totalIndiaIndonesiaIran, Islamic Rep.IraqIsraelJamaicaJordanKazakhstanKenyaKiribatiKorea, Rep.KosovoKuwaitKyrgyz RepublicLao PDRLatin America & Caribbean Latin America & Caribbean (excluding high income)Latin America & the Caribbean (IDA & IBRD countries)Least developed countries: UN classificationLebanonLesothoLiberiaLibyaLow & middle incomeLow incomeLower middle incomeMacao SAR, ChinaMacedonia, FYRMadagascarMalawiMalaysiaMaldivesMaliMaltaMarshall IslandsMauritaniaMauritiusMexicoMicronesia, Fed. Sts.Middle East & North AfricaMiddle East & North Africa (excluding high income)Middle East & North Africa (IDA & IBRD countries)Middle incomeMoldovaMongoliaMontenegroMoroccoMozambiqueMyanmarNamibiaNauruNepalNew CaledoniaNicaraguaNigerNigeriaNorth AmericaOECD membersOmanOther small statesPacific island small statesPakistanPalauPanamaPapua New GuineaParaguayPeruPhilippinesQatarRwandaSamoaSao Tome and PrincipeSaudi ArabiaSenegalSerbiaSeychellesSierra LeoneSingaporeSloveniaSmall statesSolomon IslandsSomaliaSouth AfricaSouth AsiaSouth Asia (IDA & IBRD)South SudanSri LankaSt. Kitts and NevisSt. LuciaSt. Vincent and the GrenadinesSub-Saharan Africa Sub-Saharan Africa (excluding high income)Sub-Saharan Africa (IDA & IBRD countries)SudanSurinameSwazilandSyrian Arab RepublicTajikistanTanzaniaThailandTimor-LesteTogoTongaTrinidad and TobagoTunisiaTurkeyTurkmenistanTuvaluUgandaUkraineUpper middle incomeUruguayUzbekistanVanuatuVenezuela, RBVietnamWest Bank and GazaWorldYemen, Rep.ZambiaZimbabwe Linea del tempo:
Questa scala temporale mostra un grafico dal 1981 anno al 2011 anno. Barbados. I dati fino ad 1980 anno non disponibili. Il numero di osservazioni attuali secondo i date: 31.
La fonte (nome):
Indicatori dello sviluppo mondiale
La fonte (organizzazione):
Development Assistance Committee of the Organisation for Economic Co-operation and Development, Geographical Distribution of Financial Flows to Developing Countries, Development Co-operation Report, and International Development Statistics database. Data are available online at: www.oecd.org/dac/stats/idsonline. World Bank GNI estimates are used for the denominator.
Categorie:
Aid Effectiveness, Economy & Growth, External Debt
sono stati aggiornati
23 apr 2017 anni
Indicatori delle variazioni dei valori per anni
Minima:
-0.073
1 gen 2000 anni
Massimo:
1.561
1 gen 1982 anni
Alla data di osservazione
Valore
Variazione assoluta
La variazione rispetto al valore precedente
1 gen 1981 anni
1.381
+1.381
0.0%
1 gen 1982 anni
1.561
+0.18
13.04%
1 gen 1983 anni
1.106
-0.455
-29.17%
1 gen 1984 anni
1.537
+0.432
39.04%
1 gen 1985 anni
0.617
-0.92
-59.83%
1 gen 1986 anni
0.527
-0.09
-14.58%
1 gen 1987 anni
0.244
-0.284
-53.77%
1 gen 1988 anni
0.37
+0.126
51.7%
1 gen 1989 anni
0.164
-0.206
-55.66%
1 gen 1990 anni
0.101
-0.063
-38.13%
1 gen 1991 anni
0.135
+0.034
33.4%
1 gen 1992 anni
0.108
-0.027
-20.29%
1 gen 1993 anni
0.002
-0.106
-98.56%
1 gen 1994 anni
0.178
+0.176
11.31 Mille.%
1 gen 1995 anni
0.048
-0.129
-72.89%
1 gen 1996 anni
-0.052
-0.1
-208.52%
1 gen 1997 anni
0.179
+0.231
-442.36%
1 gen 1998 anni
0.172
-0.007
-3.68%
1 gen 1999 anni
0.556
+0.384
223.01%
1 gen 2000 anni
-0.073
-0.629
-113.05%
1 gen 2001 anni
0.008
+0.08
-110.89%
1 gen 2002 anni
-0.038
-0.046
-581.2%
1 gen 2003 anni
0.108
+0.146
-383.55%
1 gen 2004 anni
0.627
+0.519
481.39%
1 gen 2005 anni
0.848
+0.221
35.3%
1 gen 2006 anni
-0.049
-0.897
-105.73%
1 gen 2007 anni
-0.051
-0.003
5.71%
1 gen 2008 anni
0.402
+0.453
-881.67%
1 gen 2009 anni
0.164
-0.238
-59.25%
1 gen 2010 anni
0.271
+0.107
65.62%
1 gen 2011 anni
0.374
+0.103
37.83%
Classificazione dei paesi secondo i statistiche attuali per anni


Commenti: