29
/it/
it
AIzaSyAYiBZKx7MnpbEhh9jyipgxe19OcubqV5w
April 1, 2024
95240
Burkina Faso
BFA
true
2
1
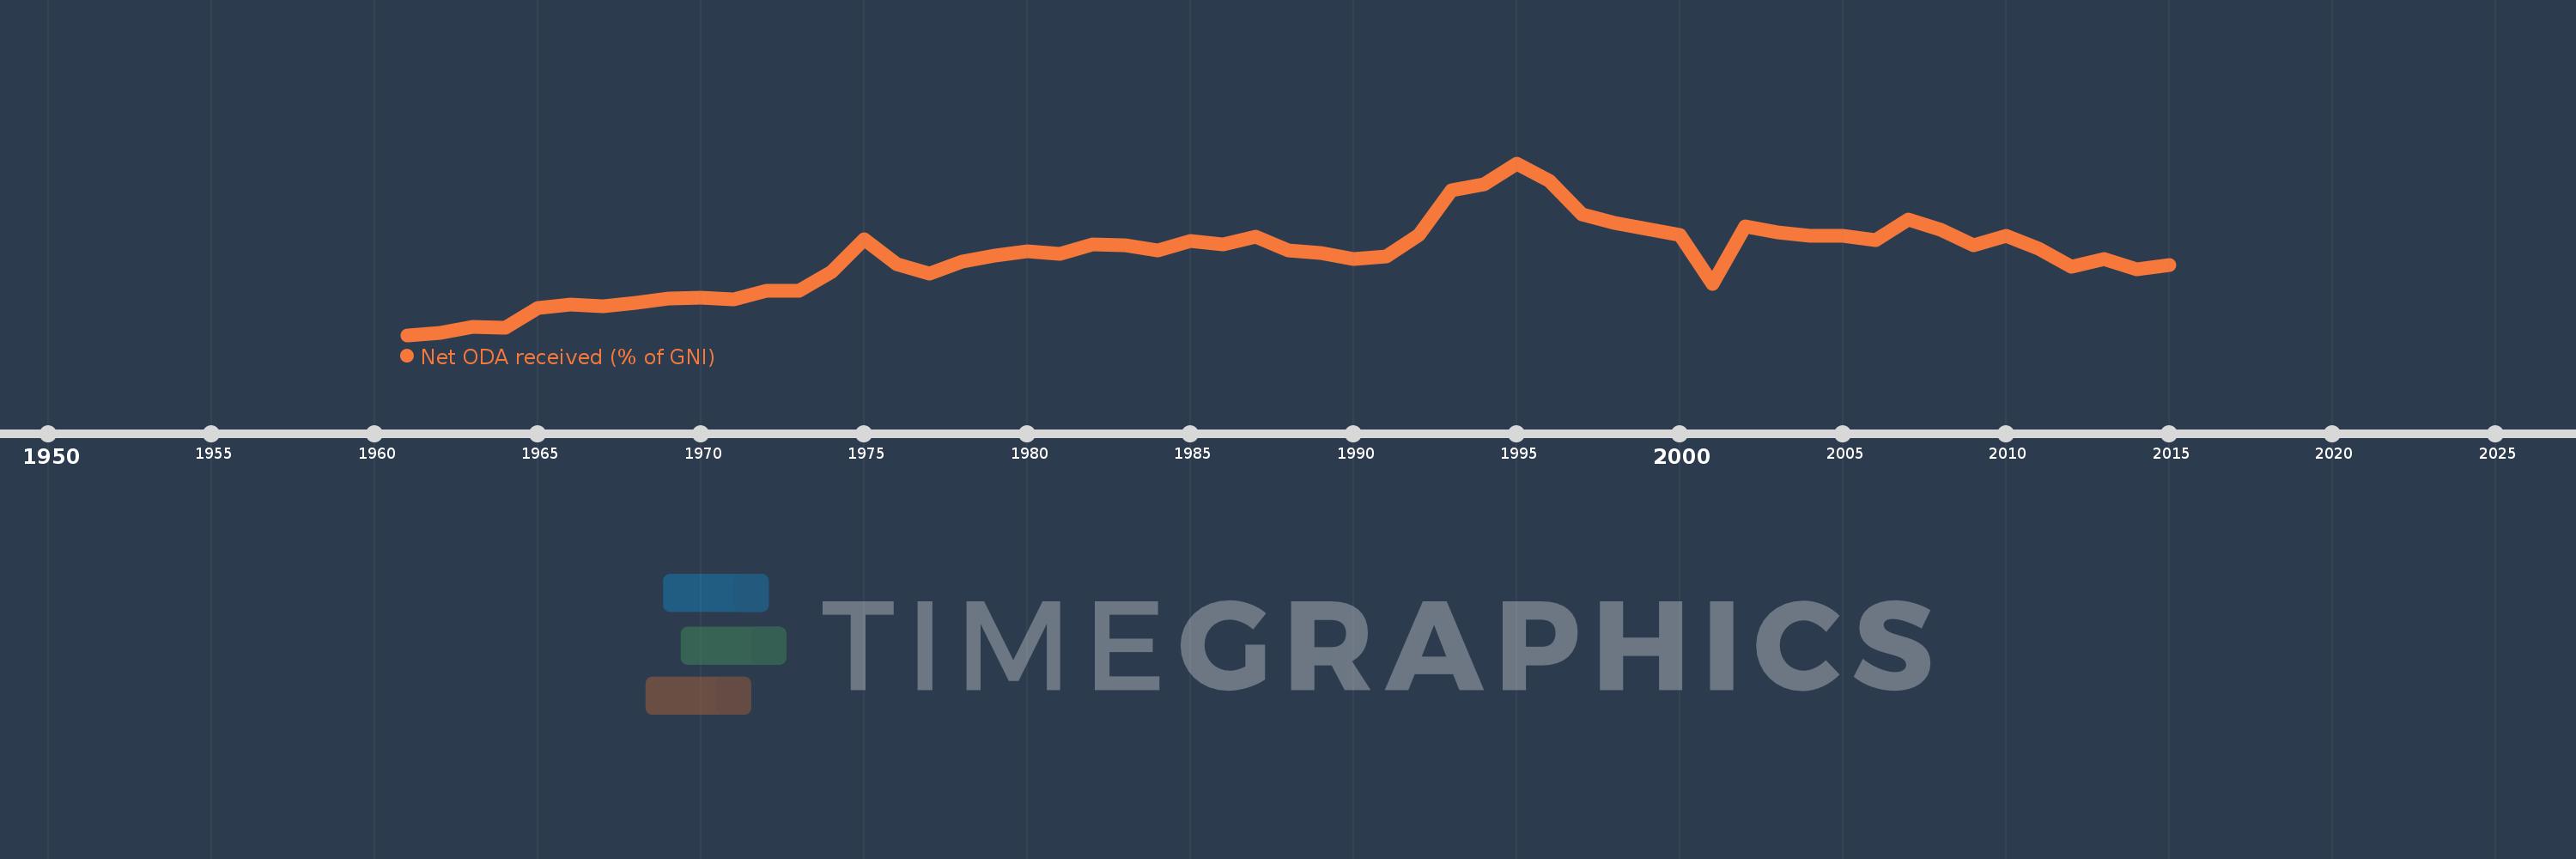
Net ODA received (% of GNI)
2015,2014,2013,2012,2011,2010,2009,2008,2007,2006,2005,2004,2003,2002,2001,2000,1999,1998,1997,1996,1995,1994,1993,1992,1991,1990,1989,1988,1987,1986,1985,1984,1983,1982,1981,1980,1979,1978,1977,1976,1975,1974,1973,1972,1971,1970,1969,1968,1967,1966,1965,1964,1963,1962,1961
Queste statistiche in altri paesi:
AfghanistanAlbaniaAlgeriaAngolaAntigua and BarbudaArab WorldArgentinaArmeniaAzerbaijanBahamas, TheBahrainBangladeshBarbadosBelarusBelizeBeninBermudaBhutanBoliviaBosnia and HerzegovinaBotswanaBrazilBrunei DarussalamBurkina FasoBurundiCabo VerdeCambodiaCameroonCaribbean small statesCentral African RepublicCentral Europe and the BalticsChadChileChinaColombiaComorosCongo, Dem. Rep.Congo, Rep.Costa RicaCote d'IvoireCroatiaCubaCyprusDjiboutiDominicaDominican RepublicEast Asia & PacificEast Asia & Pacific (excluding high income)East Asia & Pacific (IDA & IBRD countries)EcuadorEgypt, Arab Rep.El SalvadorEquatorial GuineaEritreaEthiopiaEuro areaEurope & Central AsiaEurope & Central Asia (excluding high income)Europe & Central Asia (IDA & IBRD countries)European UnionFijiFragile and conflict affected situationsFrench PolynesiaGabonGambia, TheGeorgiaGhanaGrenadaGuatemalaGuineaGuinea-BissauGuyanaHaitiHeavily indebted poor countries (HIPC)High incomeHondurasHong Kong SAR, ChinaIBRD onlyIDA & IBRD totalIDA blendIDA onlyIDA totalIndiaIndonesiaIran, Islamic Rep.IraqIsraelJamaicaJordanKazakhstanKenyaKiribatiKorea, Rep.KosovoKuwaitKyrgyz RepublicLao PDRLatin America & Caribbean Latin America & Caribbean (excluding high income)Latin America & the Caribbean (IDA & IBRD countries)Least developed countries: UN classificationLebanonLesothoLiberiaLibyaLow & middle incomeLow incomeLower middle incomeMacao SAR, ChinaMacedonia, FYRMadagascarMalawiMalaysiaMaldivesMaliMaltaMarshall IslandsMauritaniaMauritiusMexicoMicronesia, Fed. Sts.Middle East & North AfricaMiddle East & North Africa (excluding high income)Middle East & North Africa (IDA & IBRD countries)Middle incomeMoldovaMongoliaMontenegroMoroccoMozambiqueMyanmarNamibiaNauruNepalNew CaledoniaNicaraguaNigerNigeriaNorth AmericaOECD membersOmanOther small statesPacific island small statesPakistanPalauPanamaPapua New GuineaParaguayPeruPhilippinesQatarRwandaSamoaSao Tome and PrincipeSaudi ArabiaSenegalSerbiaSeychellesSierra LeoneSingaporeSloveniaSmall statesSolomon IslandsSomaliaSouth AfricaSouth AsiaSouth Asia (IDA & IBRD)South SudanSri LankaSt. Kitts and NevisSt. LuciaSt. Vincent and the GrenadinesSub-Saharan Africa Sub-Saharan Africa (excluding high income)Sub-Saharan Africa (IDA & IBRD countries)SudanSurinameSwazilandSyrian Arab RepublicTajikistanTanzaniaThailandTimor-LesteTogoTongaTrinidad and TobagoTunisiaTurkeyTurkmenistanTuvaluUgandaUkraineUpper middle incomeUruguayUzbekistanVanuatuVenezuela, RBVietnamWest Bank and GazaWorldYemen, Rep.ZambiaZimbabwe Linea del tempo:
Questa scala temporale mostra un grafico dal 1961 anno al 2015 anno. Burkina Faso. I dati fino ad 1960 anno non disponibili. Il numero di osservazioni attuali secondo i date: 55.
La fonte (nome):
Indicatori dello sviluppo mondiale
La fonte (organizzazione):
Development Assistance Committee of the Organisation for Economic Co-operation and Development, Geographical Distribution of Financial Flows to Developing Countries, Development Co-operation Report, and International Development Statistics database. Data are available online at: www.oecd.org/dac/stats/idsonline. World Bank GNI estimates are used for the denominator.
Categorie:
Aid Effectiveness, Economy & Growth, External Debt
sono stati aggiornati
23 apr 2017 anni
Indicatori delle variazioni dei valori per anni
Minima:
0.06
1 gen 1961 anni
Massimo:
22.998
1 gen 1995 anni
Alla data di osservazione
Valore
Variazione assoluta
La variazione rispetto al valore precedente
1 gen 1961 anni
0.06
+0.06
0.0%
1 gen 1962 anni
0.382
+0.322
539.59%
1 gen 1963 anni
1.142
+0.76
198.87%
1 gen 1964 anni
1.042
-0.1
-8.76%
1 gen 1965 anni
3.722
+2.68
257.33%
1 gen 1966 anni
4.119
+0.397
10.66%
1 gen 1967 anni
3.901
-0.218
-5.29%
1 gen 1968 anni
4.369
+0.468
12.0%
1 gen 1969 anni
4.971
+0.602
13.77%
1 gen 1970 anni
5.035
+0.063
1.28%
1 gen 1971 anni
4.797
-0.238
-4.72%
1 gen 1972 anni
5.974
+1.177
24.54%
1 gen 1973 anni
5.945
-0.029
-0.49%
1 gen 1974 anni
8.435
+2.49
41.89%
1 gen 1975 anni
12.862
+4.426
52.47%
1 gen 1976 anni
9.538
-3.324
-25.85%
1 gen 1977 anni
8.259
-1.278
-13.4%
1 gen 1978 anni
9.817
+1.558
18.86%
1 gen 1979 anni
10.712
+0.895
9.12%
1 gen 1980 anni
11.278
+0.566
5.28%
1 gen 1981 anni
10.909
-0.369
-3.27%
1 gen 1982 anni
12.165
+1.255
11.51%
1 gen 1983 anni
12.051
-0.114
-0.93%
1 gen 1984 anni
11.391
-0.66
-5.48%
1 gen 1985 anni
12.577
+1.185
10.41%
1 gen 1986 anni
12.186
-0.391
-3.11%
1 gen 1987 anni
13.241
+1.055
8.66%
1 gen 1988 anni
11.359
-1.882
-14.22%
1 gen 1989 anni
11.018
-0.341
-3.0%
1 gen 1990 anni
10.189
-0.829
-7.52%
1 gen 1991 anni
10.554
+0.365
3.58%
1 gen 1992 anni
13.425
+2.871
27.21%
1 gen 1993 anni
19.414
+5.989
44.61%
1 gen 1994 anni
20.207
+0.793
4.09%
1 gen 1995 anni
22.998
+2.791
13.81%
1 gen 1996 anni
20.678
-2.321
-10.09%
1 gen 1997 anni
16.146
-4.531
-21.91%
1 gen 1998 anni
15.067
-1.079
-6.68%
1 gen 1999 anni
14.274
-0.793
-5.27%
1 gen 2000 anni
13.405
-0.869
-6.09%
1 gen 2001 anni
6.891
-6.514
-48.59%
1 gen 2002 anni
14.56
+7.669
111.28%
1 gen 2003 anni
13.79
-0.77
-5.29%
1 gen 2004 anni
13.279
-0.511
-3.71%
1 gen 2005 anni
13.361
+0.082
0.62%
1 gen 2006 anni
12.751
-0.61
-4.57%
1 gen 2007 anni
15.432
+2.681
21.03%
1 gen 2008 anni
14.059
-1.374
-8.9%
1 gen 2009 anni
11.993
-2.066
-14.69%
1 gen 2010 anni
13.288
+1.295
10.8%
1 gen 2011 anni
11.626
-1.662
-12.51%
1 gen 2012 anni
9.153
-2.473
-21.27%
1 gen 2013 anni
10.222
+1.069
11.68%
1 gen 2014 anni
8.889
-1.333
-13.04%
1 gen 2015 anni
9.413
+0.524
5.9%
Classificazione dei paesi secondo i statistiche attuali per anni


Commenti: