29
/it/
it
AIzaSyAYiBZKx7MnpbEhh9jyipgxe19OcubqV5w
April 1, 2024
150782
Honduras
HND
true
2
1
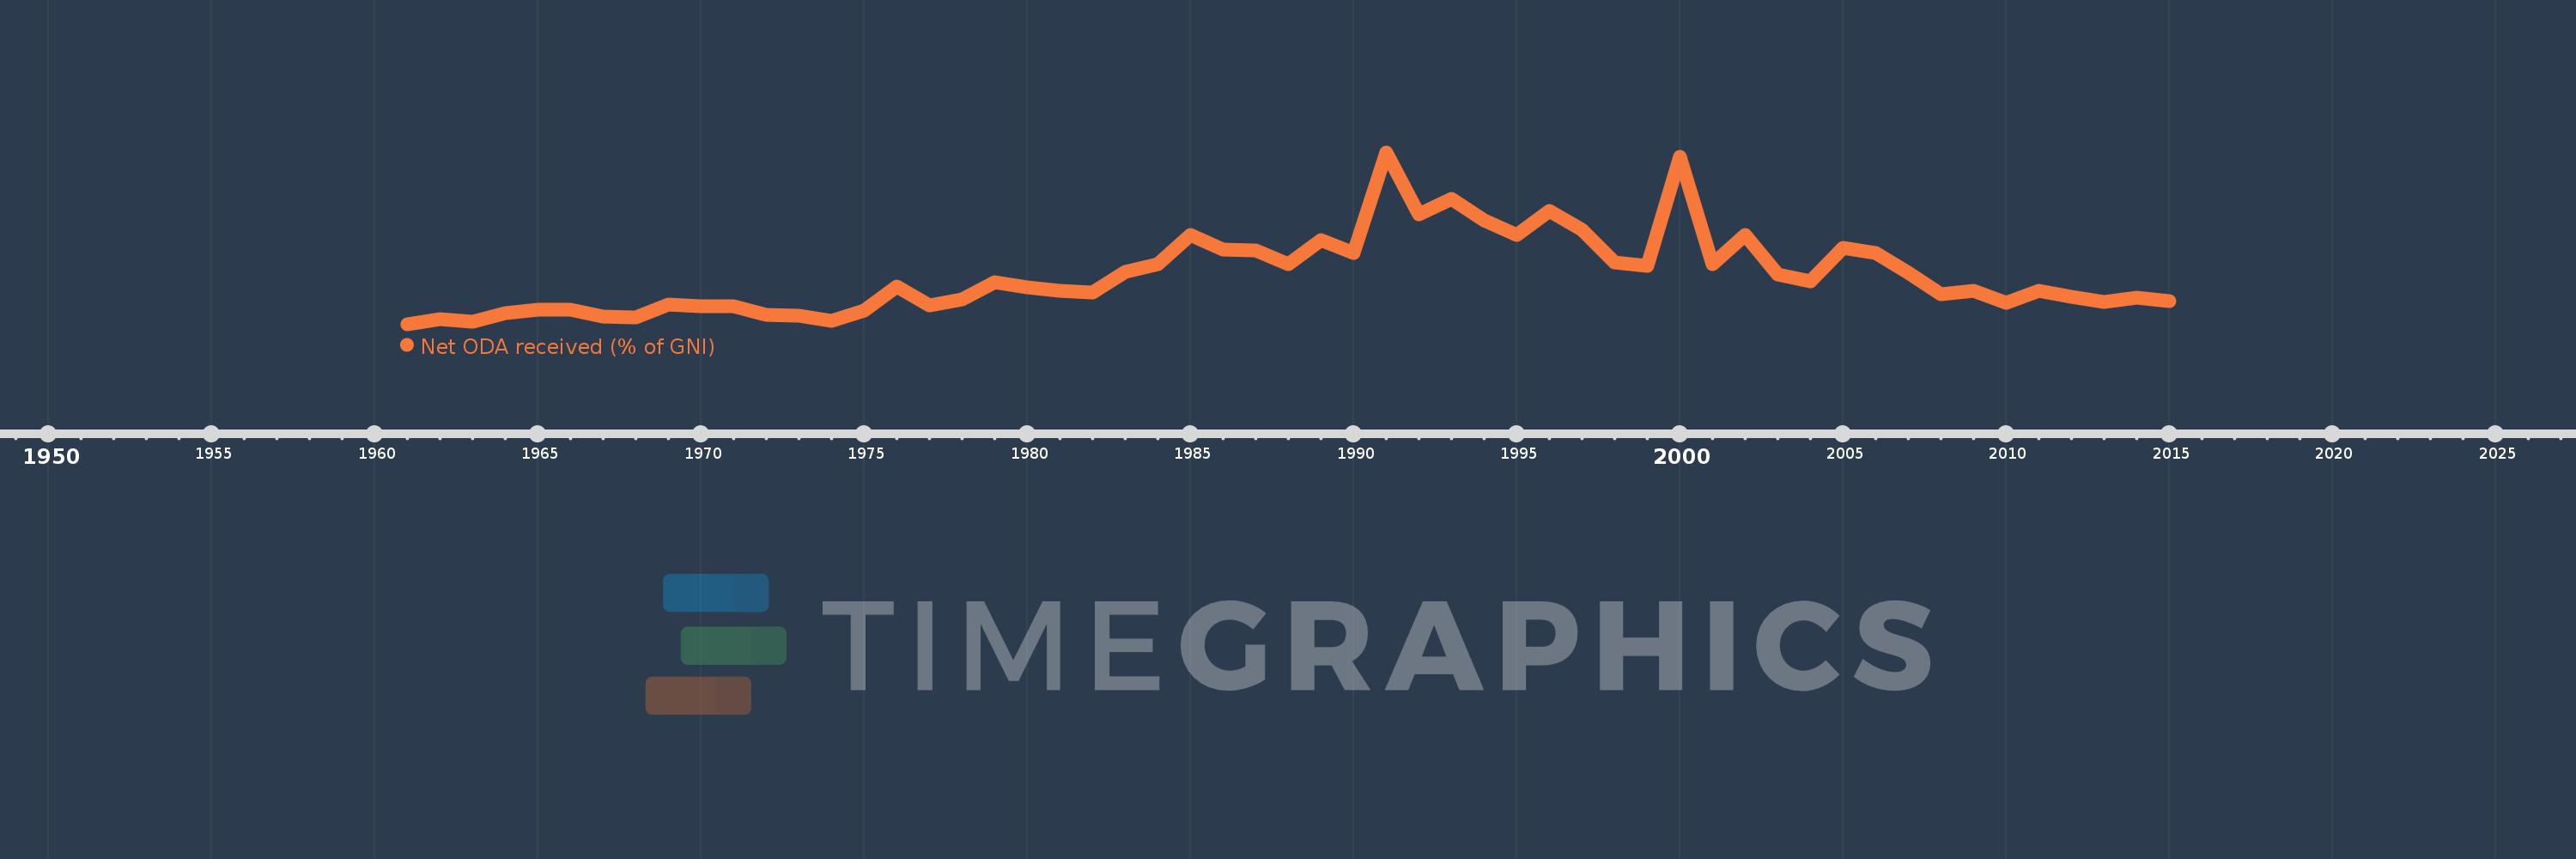
Net ODA received (% of GNI)
2015,2014,2013,2012,2011,2010,2009,2008,2007,2006,2005,2004,2003,2002,2001,2000,1999,1998,1997,1996,1995,1994,1993,1992,1991,1990,1989,1988,1987,1986,1985,1984,1983,1982,1981,1980,1979,1978,1977,1976,1975,1974,1973,1972,1971,1970,1969,1968,1967,1966,1965,1964,1963,1962,1961
Queste statistiche in altri paesi:
AfghanistanAlbaniaAlgeriaAngolaAntigua and BarbudaArab WorldArgentinaArmeniaAzerbaijanBahamas, TheBahrainBangladeshBarbadosBelarusBelizeBeninBermudaBhutanBoliviaBosnia and HerzegovinaBotswanaBrazilBrunei DarussalamBurkina FasoBurundiCabo VerdeCambodiaCameroonCaribbean small statesCentral African RepublicCentral Europe and the BalticsChadChileChinaColombiaComorosCongo, Dem. Rep.Congo, Rep.Costa RicaCote d'IvoireCroatiaCubaCyprusDjiboutiDominicaDominican RepublicEast Asia & PacificEast Asia & Pacific (excluding high income)East Asia & Pacific (IDA & IBRD countries)EcuadorEgypt, Arab Rep.El SalvadorEquatorial GuineaEritreaEthiopiaEuro areaEurope & Central AsiaEurope & Central Asia (excluding high income)Europe & Central Asia (IDA & IBRD countries)European UnionFijiFragile and conflict affected situationsFrench PolynesiaGabonGambia, TheGeorgiaGhanaGrenadaGuatemalaGuineaGuinea-BissauGuyanaHaitiHeavily indebted poor countries (HIPC)High incomeHondurasHong Kong SAR, ChinaIBRD onlyIDA & IBRD totalIDA blendIDA onlyIDA totalIndiaIndonesiaIran, Islamic Rep.IraqIsraelJamaicaJordanKazakhstanKenyaKiribatiKorea, Rep.KosovoKuwaitKyrgyz RepublicLao PDRLatin America & Caribbean Latin America & Caribbean (excluding high income)Latin America & the Caribbean (IDA & IBRD countries)Least developed countries: UN classificationLebanonLesothoLiberiaLibyaLow & middle incomeLow incomeLower middle incomeMacao SAR, ChinaMacedonia, FYRMadagascarMalawiMalaysiaMaldivesMaliMaltaMarshall IslandsMauritaniaMauritiusMexicoMicronesia, Fed. Sts.Middle East & North AfricaMiddle East & North Africa (excluding high income)Middle East & North Africa (IDA & IBRD countries)Middle incomeMoldovaMongoliaMontenegroMoroccoMozambiqueMyanmarNamibiaNauruNepalNew CaledoniaNicaraguaNigerNigeriaNorth AmericaOECD membersOmanOther small statesPacific island small statesPakistanPalauPanamaPapua New GuineaParaguayPeruPhilippinesQatarRwandaSamoaSao Tome and PrincipeSaudi ArabiaSenegalSerbiaSeychellesSierra LeoneSingaporeSloveniaSmall statesSolomon IslandsSomaliaSouth AfricaSouth AsiaSouth Asia (IDA & IBRD)South SudanSri LankaSt. Kitts and NevisSt. LuciaSt. Vincent and the GrenadinesSub-Saharan Africa Sub-Saharan Africa (excluding high income)Sub-Saharan Africa (IDA & IBRD countries)SudanSurinameSwazilandSyrian Arab RepublicTajikistanTanzaniaThailandTimor-LesteTogoTongaTrinidad and TobagoTunisiaTurkeyTurkmenistanTuvaluUgandaUkraineUpper middle incomeUruguayUzbekistanVanuatuVenezuela, RBVietnamWest Bank and GazaWorldYemen, Rep.ZambiaZimbabwe Linea del tempo:
Questa scala temporale mostra un grafico dal 1961 anno al 2015 anno. Honduras. I dati fino ad 1960 anno non disponibili. Il numero di osservazioni attuali secondo i date: 55.
La fonte (nome):
Indicatori dello sviluppo mondiale
La fonte (organizzazione):
Development Assistance Committee of the Organisation for Economic Co-operation and Development, Geographical Distribution of Financial Flows to Developing Countries, Development Co-operation Report, and International Development Statistics database. Data are available online at: www.oecd.org/dac/stats/idsonline. World Bank GNI estimates are used for the denominator.
Categorie:
Aid Effectiveness, Economy & Growth, External Debt
sono stati aggiornati
23 apr 2017 anni
Indicatori delle variazioni dei valori per anni
Minima:
1.386
1 gen 1961 anni
Massimo:
16.035
1 gen 1991 anni
Alla data di osservazione
Valore
Variazione assoluta
La variazione rispetto al valore precedente
1 gen 1961 anni
1.386
+1.386
0.0%
1 gen 1962 anni
1.793
+0.407
29.39%
1 gen 1963 anni
1.565
-0.229
-12.75%
1 gen 1964 anni
2.363
+0.798
51.0%
1 gen 1965 anni
2.656
+0.293
12.4%
1 gen 1966 anni
2.597
-0.058
-2.2%
1 gen 1967 anni
2.051
-0.546
-21.04%
1 gen 1968 anni
1.978
-0.073
-3.55%
1 gen 1969 anni
3.05
+1.072
54.19%
1 gen 1970 anni
2.906
-0.144
-4.71%
1 gen 1971 anni
2.905
0.0
-0.01%
1 gen 1972 anni
2.171
-0.734
-25.27%
1 gen 1973 anni
2.147
-0.024
-1.12%
1 gen 1974 anni
1.692
-0.455
-21.2%
1 gen 1975 anni
2.583
+0.891
52.66%
1 gen 1976 anni
4.616
+2.033
78.71%
1 gen 1977 anni
3.025
-1.591
-34.46%
1 gen 1978 anni
3.504
+0.479
15.84%
1 gen 1979 anni
4.963
+1.459
41.63%
1 gen 1980 anni
4.496
-0.467
-9.41%
1 gen 1981 anni
4.22
-0.276
-6.13%
1 gen 1982 anni
4.055
-0.165
-3.9%
1 gen 1983 anni
5.815
+1.76
43.4%
1 gen 1984 anni
6.47
+0.655
11.26%
1 gen 1985 anni
9.02
+2.55
39.41%
1 gen 1986 anni
7.756
-1.264
-14.02%
1 gen 1987 anni
7.714
-0.042
-0.54%
1 gen 1988 anni
6.471
-1.243
-16.11%
1 gen 1989 anni
8.522
+2.05
31.68%
1 gen 1990 anni
7.457
-1.065
-12.49%
1 gen 1991 anni
16.035
+8.578
115.04%
1 gen 1992 anni
10.761
-5.275
-32.89%
1 gen 1993 anni
12.068
+1.307
12.15%
1 gen 1994 anni
10.237
-1.831
-15.17%
1 gen 1995 anni
9.005
-1.232
-12.03%
1 gen 1996 anni
11.028
+2.024
22.47%
1 gen 1997 anni
9.43
-1.599
-14.5%
1 gen 1998 anni
6.659
-2.771
-29.38%
1 gen 1999 anni
6.336
-0.323
-4.85%
1 gen 2000 anni
15.657
+9.321
147.1%
1 gen 2001 anni
6.513
-9.145
-58.4%
1 gen 2002 anni
8.988
+2.476
38.01%
1 gen 2003 anni
5.63
-3.358
-37.36%
1 gen 2004 anni
5.063
-0.567
-10.08%
1 gen 2005 anni
7.906
+2.843
56.15%
1 gen 2006 anni
7.485
-0.421
-5.32%
1 gen 2007 anni
5.763
-1.722
-23.0%
1 gen 2008 anni
3.909
-1.854
-32.17%
1 gen 2009 anni
4.216
+0.307
7.85%
1 gen 2010 anni
3.212
-1.004
-23.82%
1 gen 2011 anni
4.22
+1.008
31.39%
1 gen 2012 anni
3.719
-0.501
-11.87%
1 gen 2013 anni
3.318
-0.401
-10.79%
1 gen 2014 anni
3.673
+0.355
10.71%
1 gen 2015 anni
3.344
-0.329
-8.96%
Classificazione dei paesi secondo i statistiche attuali per anni


Commenti: