29
/it/
it
AIzaSyAYiBZKx7MnpbEhh9jyipgxe19OcubqV5w
April 1, 2024
91980
Brazil
BRA
true
2
1
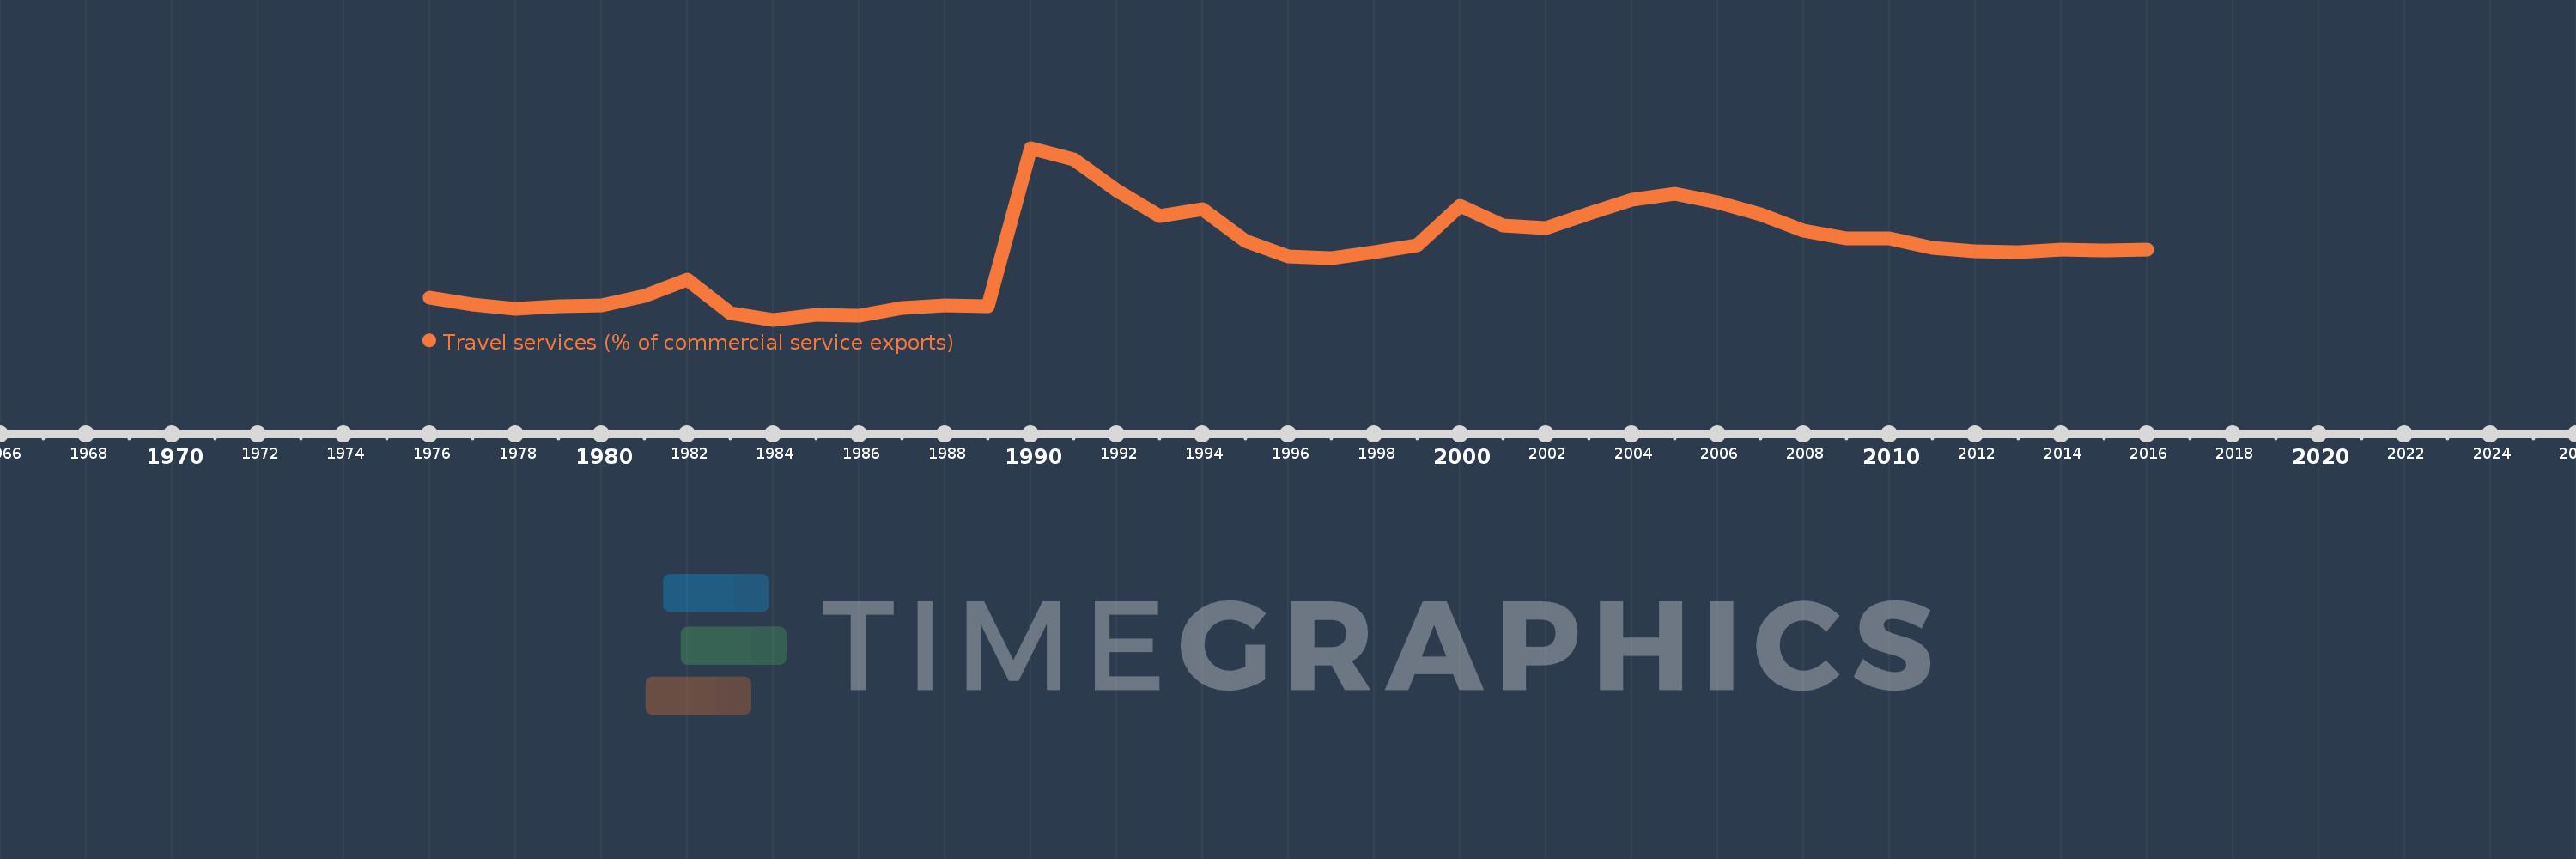
Travel services (% of commercial service exports)
2016,2015,2014,2013,2012,2011,2010,2009,2008,2007,2006,2005,2004,2003,2002,2001,2000,1999,1998,1997,1996,1995,1994,1993,1992,1991,1990,1989,1988,1987,1986,1985,1984,1983,1982,1981,1980,1979,1978,1977,1976
Queste statistiche in altri paesi:
AfghanistanAlbaniaAlgeriaAngolaAntigua and BarbudaArab WorldArgentinaArmeniaArubaAustraliaAustriaAzerbaijanBahamas, TheBahrainBangladeshBarbadosBelarusBelgiumBelizeBeninBermudaBhutanBoliviaBosnia and HerzegovinaBotswanaBrazilBrunei DarussalamBulgariaBurkina FasoBurundiCabo VerdeCambodiaCameroonCanadaCaribbean small statesCentral African RepublicCentral Europe and the BalticsChadChileChinaColombiaComorosCongo, Dem. Rep.Congo, Rep.Costa RicaCote d'IvoireCroatiaCuracaoCyprusCzech RepublicDenmarkDjiboutiDominicaDominican RepublicEarly-demographic dividendEast Asia & PacificEast Asia & Pacific (excluding high income)East Asia & Pacific (IDA & IBRD countries)EcuadorEgypt, Arab Rep.El SalvadorEritreaEstoniaEthiopiaEuro areaEurope & Central AsiaEurope & Central Asia (excluding high income)Europe & Central Asia (IDA & IBRD countries)European UnionFaroe IslandsFijiFinlandFragile and conflict affected situationsFranceFrench PolynesiaGabonGambia, TheGeorgiaGermanyGhanaGreeceGrenadaGuatemalaGuineaGuinea-BissauGuyanaHaitiHeavily indebted poor countries (HIPC)High incomeHondurasHong Kong SAR, ChinaHungaryIBRD onlyIcelandIDA & IBRD totalIDA onlyIDA totalIndiaIndonesiaIran, Islamic Rep.IraqIrelandIsraelItalyJamaicaJapanJordanKazakhstanKenyaKiribatiKorea, Rep.KosovoKuwaitKyrgyz RepublicLao PDRLate-demographic dividendLatin America & Caribbean Latin America & Caribbean (excluding high income)Latin America & the Caribbean (IDA & IBRD countries)LatviaLeast developed countries: UN classificationLebanonLesothoLiberiaLibyaLithuaniaLow & middle incomeLow incomeLower middle incomeLuxembourgMacao SAR, ChinaMacedonia, FYRMadagascarMalawiMalaysiaMaldivesMaliMaltaMarshall IslandsMauritaniaMauritiusMexicoMicronesia, Fed. Sts.Middle East & North Africa (excluding high income)Middle East & North Africa (IDA & IBRD countries)Middle incomeMoldovaMongoliaMontenegroMoroccoMozambiqueMyanmarNamibiaNepalNetherlandsNew CaledoniaNew ZealandNicaraguaNigerNigeriaNorth AmericaNorwayOECD membersOmanOther small statesPacific island small statesPakistanPalauPanamaPapua New GuineaParaguayPeruPhilippinesPolandPortugalPost-demographic dividendPre-demographic dividendQatarRomaniaRussian FederationRwandaSamoaSao Tome and PrincipeSaudi ArabiaSenegalSerbiaSeychellesSierra LeoneSingaporeSint Maarten (Dutch part)Slovak RepublicSloveniaSmall statesSolomon IslandsSouth AfricaSouth AsiaSouth Asia (IDA & IBRD)South SudanSpainSri LankaSt. Kitts and NevisSt. LuciaSt. Vincent and the GrenadinesSub-Saharan Africa Sub-Saharan Africa (excluding high income)Sub-Saharan Africa (IDA & IBRD countries)SudanSurinameSwazilandSwedenSwitzerlandSyrian Arab RepublicTajikistanTanzaniaThailandTimor-LesteTogoTongaTrinidad and TobagoTunisiaTurkeyTuvaluUgandaUkraineUnited KingdomUnited StatesUpper middle incomeUruguayVanuatuVenezuela, RBWest Bank and GazaWorldYemen, Rep.ZambiaZimbabwe Linea del tempo:
Questa scala temporale mostra un grafico dal 1976 anno al 2016 anno. Brazil. I dati fino ad 1975 anno non disponibili. Il numero di osservazioni attuali secondo i date: 41.
La fonte (nome):
Indicatori dello sviluppo mondiale
La fonte (organizzazione):
International Monetary Fund, Balance of Payments Statistics Yearbook and data files.
Categorie:
Private Sector, Trade
sono stati aggiornati
23 apr 2017 anni
Indicatori delle variazioni dei valori per anni
Minima:
2.367
1 gen 1984 anni
Massimo:
39.87
1 gen 1990 anni
Alla data di osservazione
Valore
Variazione assoluta
La variazione rispetto al valore precedente
1 gen 1976 anni
7.26
+7.26
0.0%
1 gen 1977 anni
5.779
-1.481
-20.39%
1 gen 1978 anni
4.762
-1.017
-17.6%
1 gen 1979 anni
5.247
+0.485
10.19%
1 gen 1980 anni
5.447
+0.2
3.81%
1 gen 1981 anni
7.536
+2.089
38.36%
1 gen 1982 anni
11.096
+3.56
47.24%
1 gen 1983 anni
3.795
-7.301
-65.8%
1 gen 1984 anni
2.367
-1.429
-37.65%
1 gen 1985 anni
3.491
+1.124
47.51%
1 gen 1986 anni
3.312
-0.179
-5.14%
1 gen 1987 anni
4.852
+1.54
46.5%
1 gen 1988 anni
5.411
+0.56
11.53%
1 gen 1989 anni
5.323
-0.088
-1.63%
1 gen 1990 anni
39.87
+34.547
649.01%
1 gen 1991 anni
37.318
-2.552
-6.4%
1 gen 1992 anni
30.661
-6.657
-17.84%
1 gen 1993 anni
24.963
-5.698
-18.59%
1 gen 1994 anni
26.576
+1.614
6.47%
1 gen 1995 anni
19.597
-6.979
-26.26%
1 gen 1996 anni
16.187
-3.411
-17.4%
1 gen 1997 anni
15.753
-0.434
-2.68%
1 gen 1998 anni
17.183
+1.43
9.08%
1 gen 1999 anni
18.555
+1.372
7.98%
1 gen 2000 anni
27.172
+8.618
46.45%
1 gen 2001 anni
22.912
-4.261
-15.68%
1 gen 2002 anni
22.437
-0.475
-2.07%
1 gen 2003 anni
25.511
+3.074
13.7%
1 gen 2004 anni
28.488
+2.977
11.67%
1 gen 2005 anni
29.903
+1.414
4.96%
1 gen 2006 anni
28.014
-1.889
-6.32%
1 gen 2007 anni
25.42
-2.594
-9.26%
1 gen 2008 anni
21.902
-3.518
-13.84%
1 gen 2009 anni
20.072
-1.83
-8.36%
1 gen 2010 anni
20.212
+0.14
0.7%
1 gen 2011 anni
17.972
-2.24
-11.08%
1 gen 2012 anni
17.25
-0.722
-4.02%
1 gen 2013 anni
17.057
-0.193
-1.12%
1 gen 2014 anni
17.764
+0.707
4.15%
1 gen 2015 anni
17.524
-0.24
-1.35%
1 gen 2016 anni
17.715
+0.191
1.09%
Classificazione dei paesi secondo i statistiche attuali per anni


Commenti: