29
/it/
it
AIzaSyAYiBZKx7MnpbEhh9jyipgxe19OcubqV5w
April 1, 2024
226505
Portugal
PRT
true
2
1
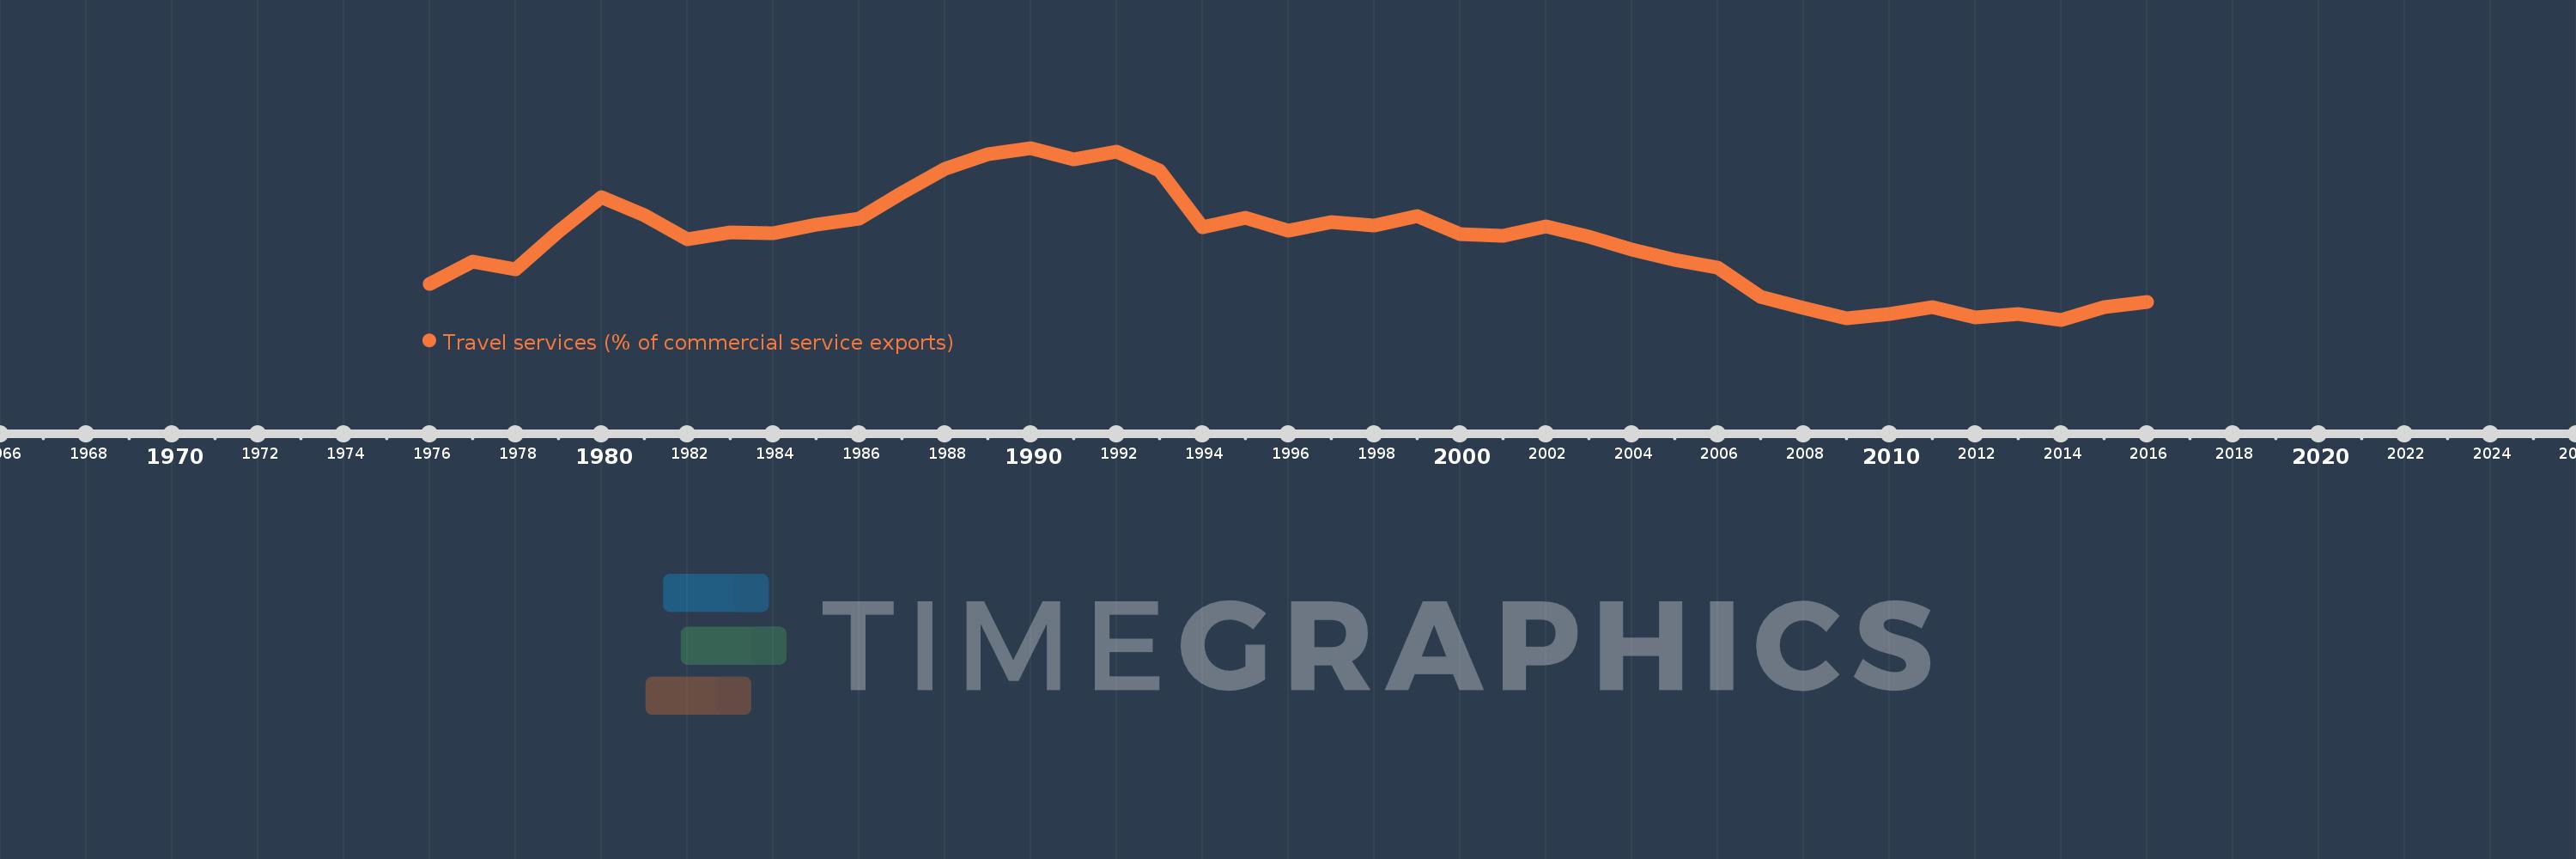
Travel services (% of commercial service exports)
2016,2015,2014,2013,2012,2011,2010,2009,2008,2007,2006,2005,2004,2003,2002,2001,2000,1999,1998,1997,1996,1995,1994,1993,1992,1991,1990,1989,1988,1987,1986,1985,1984,1983,1982,1981,1980,1979,1978,1977,1976
Queste statistiche in altri paesi:
AfghanistanAlbaniaAlgeriaAngolaAntigua and BarbudaArab WorldArgentinaArmeniaArubaAustraliaAustriaAzerbaijanBahamas, TheBahrainBangladeshBarbadosBelarusBelgiumBelizeBeninBermudaBhutanBoliviaBosnia and HerzegovinaBotswanaBrazilBrunei DarussalamBulgariaBurkina FasoBurundiCabo VerdeCambodiaCameroonCanadaCaribbean small statesCentral African RepublicCentral Europe and the BalticsChadChileChinaColombiaComorosCongo, Dem. Rep.Congo, Rep.Costa RicaCote d'IvoireCroatiaCuracaoCyprusCzech RepublicDenmarkDjiboutiDominicaDominican RepublicEarly-demographic dividendEast Asia & PacificEast Asia & Pacific (excluding high income)East Asia & Pacific (IDA & IBRD countries)EcuadorEgypt, Arab Rep.El SalvadorEritreaEstoniaEthiopiaEuro areaEurope & Central AsiaEurope & Central Asia (excluding high income)Europe & Central Asia (IDA & IBRD countries)European UnionFaroe IslandsFijiFinlandFragile and conflict affected situationsFranceFrench PolynesiaGabonGambia, TheGeorgiaGermanyGhanaGreeceGrenadaGuatemalaGuineaGuinea-BissauGuyanaHaitiHeavily indebted poor countries (HIPC)High incomeHondurasHong Kong SAR, ChinaHungaryIBRD onlyIcelandIDA & IBRD totalIDA onlyIDA totalIndiaIndonesiaIran, Islamic Rep.IraqIrelandIsraelItalyJamaicaJapanJordanKazakhstanKenyaKiribatiKorea, Rep.KosovoKuwaitKyrgyz RepublicLao PDRLate-demographic dividendLatin America & Caribbean Latin America & Caribbean (excluding high income)Latin America & the Caribbean (IDA & IBRD countries)LatviaLeast developed countries: UN classificationLebanonLesothoLiberiaLibyaLithuaniaLow & middle incomeLow incomeLower middle incomeLuxembourgMacao SAR, ChinaMacedonia, FYRMadagascarMalawiMalaysiaMaldivesMaliMaltaMarshall IslandsMauritaniaMauritiusMexicoMicronesia, Fed. Sts.Middle East & North Africa (excluding high income)Middle East & North Africa (IDA & IBRD countries)Middle incomeMoldovaMongoliaMontenegroMoroccoMozambiqueMyanmarNamibiaNepalNetherlandsNew CaledoniaNew ZealandNicaraguaNigerNigeriaNorth AmericaNorwayOECD membersOmanOther small statesPacific island small statesPakistanPalauPanamaPapua New GuineaParaguayPeruPhilippinesPolandPortugalPost-demographic dividendPre-demographic dividendQatarRomaniaRussian FederationRwandaSamoaSao Tome and PrincipeSaudi ArabiaSenegalSerbiaSeychellesSierra LeoneSingaporeSint Maarten (Dutch part)Slovak RepublicSloveniaSmall statesSolomon IslandsSouth AfricaSouth AsiaSouth Asia (IDA & IBRD)South SudanSpainSri LankaSt. Kitts and NevisSt. LuciaSt. Vincent and the GrenadinesSub-Saharan Africa Sub-Saharan Africa (excluding high income)Sub-Saharan Africa (IDA & IBRD countries)SudanSurinameSwazilandSwedenSwitzerlandSyrian Arab RepublicTajikistanTanzaniaThailandTimor-LesteTogoTongaTrinidad and TobagoTunisiaTurkeyTuvaluUgandaUkraineUnited KingdomUnited StatesUpper middle incomeUruguayVanuatuVenezuela, RBWest Bank and GazaWorldYemen, Rep.ZambiaZimbabwe Linea del tempo:
Questa scala temporale mostra un grafico dal 1976 anno al 2016 anno. Portugal. I dati fino ad 1975 anno non disponibili. Il numero di osservazioni attuali secondo i date: 41.
La fonte (nome):
Indicatori dello sviluppo mondiale
La fonte (organizzazione):
International Monetary Fund, Balance of Payments Statistics Yearbook and data files.
Categorie:
Private Sector, Trade
sono stati aggiornati
23 apr 2017 anni
Indicatori delle variazioni dei valori per anni
Minima:
42.267
1 gen 2014 anni
Massimo:
72.43
1 gen 1990 anni
Alla data di osservazione
Valore
Variazione assoluta
La variazione rispetto al valore precedente
1 gen 1976 anni
48.576
+48.576
0.0%
1 gen 1977 anni
52.425
+3.849
7.92%
1 gen 1978 anni
51.16
-1.266
-2.41%
1 gen 1979 anni
57.821
+6.661
13.02%
1 gen 1980 anni
63.773
+5.952
10.29%
1 gen 1981 anni
60.692
-3.081
-4.83%
1 gen 1982 anni
56.41
-4.282
-7.06%
1 gen 1983 anni
57.545
+1.136
2.01%
1 gen 1984 anni
57.429
-0.116
-0.2%
1 gen 1985 anni
59.031
+1.602
2.79%
1 gen 1986 anni
59.991
+0.96
1.63%
1 gen 1987 anni
64.541
+4.551
7.59%
1 gen 1988 anni
68.695
+4.153
6.43%
1 gen 1989 anni
71.314
+2.62
3.81%
1 gen 1990 anni
72.43
+1.115
1.56%
1 gen 1991 anni
70.364
-2.066
-2.85%
1 gen 1992 anni
71.802
+1.438
2.04%
1 gen 1993 anni
68.499
-3.302
-4.6%
1 gen 1994 anni
58.5
-10.0
-14.6%
1 gen 1995 anni
60.145
+1.645
2.81%
1 gen 1996 anni
57.901
-2.244
-3.73%
1 gen 1997 anni
59.361
+1.46
2.52%
1 gen 1998 anni
58.8
-0.561
-0.95%
1 gen 1999 anni
60.515
+1.715
2.92%
1 gen 2000 anni
57.291
-3.225
-5.33%
1 gen 2001 anni
56.981
-0.31
-0.54%
1 gen 2002 anni
58.603
+1.622
2.85%
1 gen 2003 anni
56.822
-1.781
-3.04%
1 gen 2004 anni
54.518
-2.304
-4.05%
1 gen 2005 anni
52.831
-1.687
-3.1%
1 gen 2006 anni
51.375
-1.456
-2.76%
1 gen 2007 anni
46.269
-5.106
-9.94%
1 gen 2008 anni
44.268
-2.001
-4.32%
1 gen 2009 anni
42.573
-1.695
-3.83%
1 gen 2010 anni
43.306
+0.733
1.72%
1 gen 2011 anni
44.439
+1.133
2.62%
1 gen 2012 anni
42.701
-1.738
-3.91%
1 gen 2013 anni
43.245
+0.544
1.27%
1 gen 2014 anni
42.267
-0.977
-2.26%
1 gen 2015 anni
44.455
+2.187
5.17%
1 gen 2016 anni
45.429
+0.974
2.19%
Classificazione dei paesi secondo i statistiche attuali per anni


Commenti: