29
/it/
it
AIzaSyAYiBZKx7MnpbEhh9jyipgxe19OcubqV5w
April 1, 2024
30371
Euro area
EMU
false
2
1
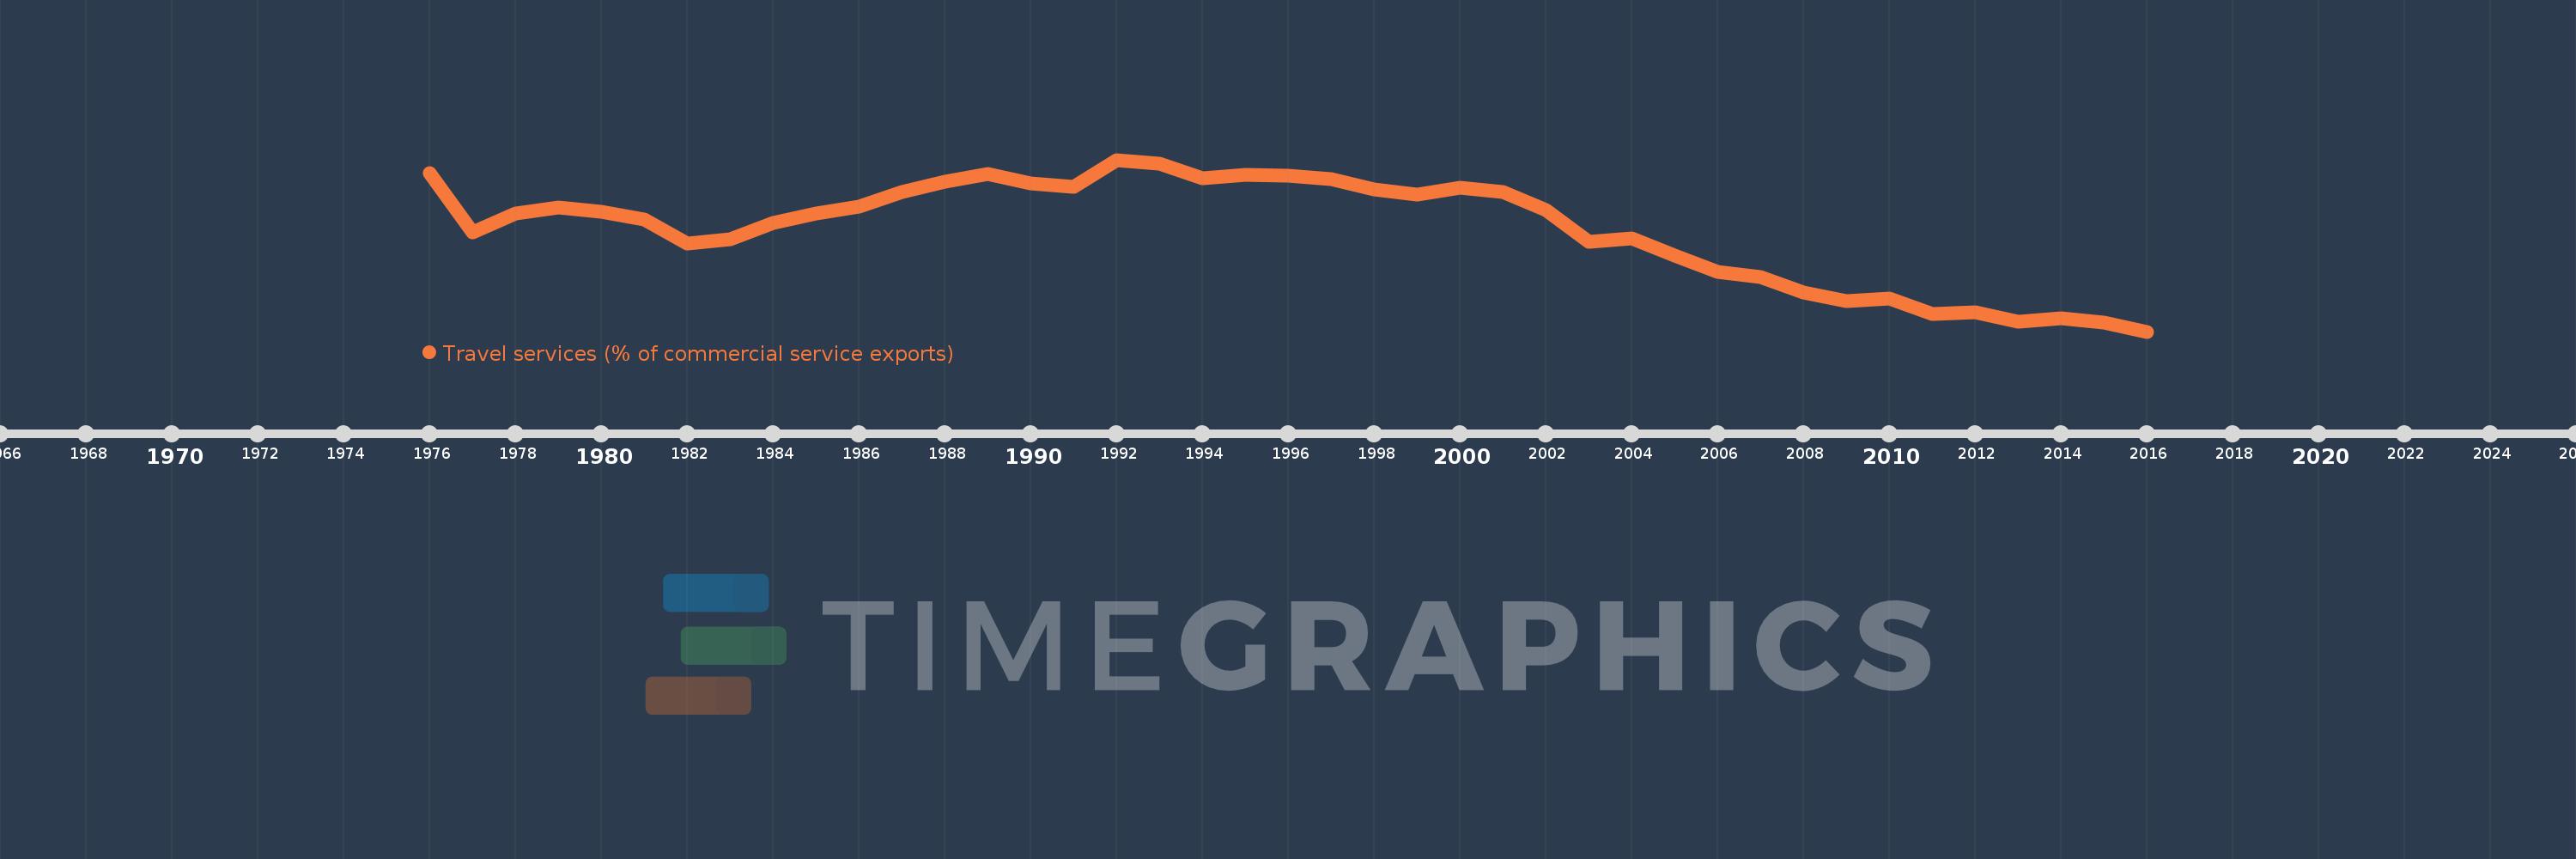
Travel services (% of commercial service exports)
2016,2015,2014,2013,2012,2011,2010,2009,2008,2007,2006,2005,2004,2003,2002,2001,2000,1999,1998,1997,1996,1995,1994,1993,1992,1991,1990,1989,1988,1987,1986,1985,1984,1983,1982,1981,1980,1979,1978,1977,1976
Queste statistiche in altri paesi:
AfghanistanAlbaniaAlgeriaAngolaAntigua and BarbudaArab WorldArgentinaArmeniaArubaAustraliaAustriaAzerbaijanBahamas, TheBahrainBangladeshBarbadosBelarusBelgiumBelizeBeninBermudaBhutanBoliviaBosnia and HerzegovinaBotswanaBrazilBrunei DarussalamBulgariaBurkina FasoBurundiCabo VerdeCambodiaCameroonCanadaCaribbean small statesCentral African RepublicCentral Europe and the BalticsChadChileChinaColombiaComorosCongo, Dem. Rep.Congo, Rep.Costa RicaCote d'IvoireCroatiaCuracaoCyprusCzech RepublicDenmarkDjiboutiDominicaDominican RepublicEarly-demographic dividendEast Asia & PacificEast Asia & Pacific (excluding high income)East Asia & Pacific (IDA & IBRD countries)EcuadorEgypt, Arab Rep.El SalvadorEritreaEstoniaEthiopiaEuro areaEurope & Central AsiaEurope & Central Asia (excluding high income)Europe & Central Asia (IDA & IBRD countries)European UnionFaroe IslandsFijiFinlandFragile and conflict affected situationsFranceFrench PolynesiaGabonGambia, TheGeorgiaGermanyGhanaGreeceGrenadaGuatemalaGuineaGuinea-BissauGuyanaHaitiHeavily indebted poor countries (HIPC)High incomeHondurasHong Kong SAR, ChinaHungaryIBRD onlyIcelandIDA & IBRD totalIDA onlyIDA totalIndiaIndonesiaIran, Islamic Rep.IraqIrelandIsraelItalyJamaicaJapanJordanKazakhstanKenyaKiribatiKorea, Rep.KosovoKuwaitKyrgyz RepublicLao PDRLate-demographic dividendLatin America & Caribbean Latin America & Caribbean (excluding high income)Latin America & the Caribbean (IDA & IBRD countries)LatviaLeast developed countries: UN classificationLebanonLesothoLiberiaLibyaLithuaniaLow & middle incomeLow incomeLower middle incomeLuxembourgMacao SAR, ChinaMacedonia, FYRMadagascarMalawiMalaysiaMaldivesMaliMaltaMarshall IslandsMauritaniaMauritiusMexicoMicronesia, Fed. Sts.Middle East & North Africa (excluding high income)Middle East & North Africa (IDA & IBRD countries)Middle incomeMoldovaMongoliaMontenegroMoroccoMozambiqueMyanmarNamibiaNepalNetherlandsNew CaledoniaNew ZealandNicaraguaNigerNigeriaNorth AmericaNorwayOECD membersOmanOther small statesPacific island small statesPakistanPalauPanamaPapua New GuineaParaguayPeruPhilippinesPolandPortugalPost-demographic dividendPre-demographic dividendQatarRomaniaRussian FederationRwandaSamoaSao Tome and PrincipeSaudi ArabiaSenegalSerbiaSeychellesSierra LeoneSingaporeSint Maarten (Dutch part)Slovak RepublicSloveniaSmall statesSolomon IslandsSouth AfricaSouth AsiaSouth Asia (IDA & IBRD)South SudanSpainSri LankaSt. Kitts and NevisSt. LuciaSt. Vincent and the GrenadinesSub-Saharan Africa Sub-Saharan Africa (excluding high income)Sub-Saharan Africa (IDA & IBRD countries)SudanSurinameSwazilandSwedenSwitzerlandSyrian Arab RepublicTajikistanTanzaniaThailandTimor-LesteTogoTongaTrinidad and TobagoTunisiaTurkeyTuvaluUgandaUkraineUnited KingdomUnited StatesUpper middle incomeUruguayVanuatuVenezuela, RBWest Bank and GazaWorldYemen, Rep.ZambiaZimbabwe Linea del tempo:
Questa scala temporale mostra un grafico dal 1976 anno al 2016 anno. Euro area. I dati fino ad 1975 anno non disponibili. Il numero di osservazioni attuali secondo i date: 41.
La fonte (nome):
Indicatori dello sviluppo mondiale
La fonte (organizzazione):
International Monetary Fund, Balance of Payments Statistics Yearbook and data files.
Categorie:
Private Sector, Trade
sono stati aggiornati
23 apr 2017 anni
Indicatori delle variazioni dei valori per anni
Minima:
20.138
1 gen 2016 anni
Massimo:
32.775
1 gen 1992 anni
Alla data di osservazione
Valore
Variazione assoluta
La variazione rispetto al valore precedente
1 gen 1976 anni
31.781
+31.781
0.0%
1 gen 1977 anni
27.424
-4.358
-13.71%
1 gen 1978 anni
28.802
+1.379
5.03%
1 gen 1979 anni
29.279
+0.476
1.65%
1 gen 1980 anni
28.926
-0.352
-1.2%
1 gen 1981 anni
28.391
-0.535
-1.85%
1 gen 1982 anni
26.639
-1.752
-6.17%
1 gen 1983 anni
26.915
+0.276
1.04%
1 gen 1984 anni
28.137
+1.222
4.54%
1 gen 1985 anni
28.799
+0.662
2.35%
1 gen 1986 anni
29.315
+0.516
1.79%
1 gen 1987 anni
30.38
+1.064
3.63%
1 gen 1988 anni
31.133
+0.753
2.48%
1 gen 1989 anni
31.723
+0.59
1.9%
1 gen 1990 anni
31.051
-0.672
-2.12%
1 gen 1991 anni
30.803
-0.248
-0.8%
1 gen 1992 anni
32.775
+1.972
6.4%
1 gen 1993 anni
32.516
-0.259
-0.79%
1 gen 1994 anni
31.436
-1.08
-3.32%
1 gen 1995 anni
31.671
+0.235
0.75%
1 gen 1996 anni
31.609
-0.062
-0.19%
1 gen 1997 anni
31.339
-0.27
-0.85%
1 gen 1998 anni
30.584
-0.755
-2.41%
1 gen 1999 anni
30.21
-0.375
-1.22%
1 gen 2000 anni
30.738
+0.528
1.75%
1 gen 2001 anni
30.41
-0.327
-1.06%
1 gen 2002 anni
29.062
-1.349
-4.44%
1 gen 2003 anni
26.765
-2.297
-7.9%
1 gen 2004 anni
26.992
+0.227
0.85%
1 gen 2005 anni
25.71
-1.282
-4.75%
1 gen 2006 anni
24.54
-1.17
-4.55%
1 gen 2007 anni
24.119
-0.421
-1.72%
1 gen 2008 anni
23.033
-1.086
-4.5%
1 gen 2009 anni
22.394
-0.639
-2.78%
1 gen 2010 anni
22.551
+0.158
0.7%
1 gen 2011 anni
21.409
-1.143
-5.07%
1 gen 2012 anni
21.583
+0.175
0.82%
1 gen 2013 anni
20.896
-0.687
-3.18%
1 gen 2014 anni
21.115
+0.219
1.05%
1 gen 2015 anni
20.815
-0.3
-1.42%
1 gen 2016 anni
20.138
-0.677
-3.25%
Classificazione dei paesi secondo i statistiche attuali per anni


Commenti: