29
/it/
it
AIzaSyAYiBZKx7MnpbEhh9jyipgxe19OcubqV5w
April 1, 2024
52317
North America
NAC
false
2
1
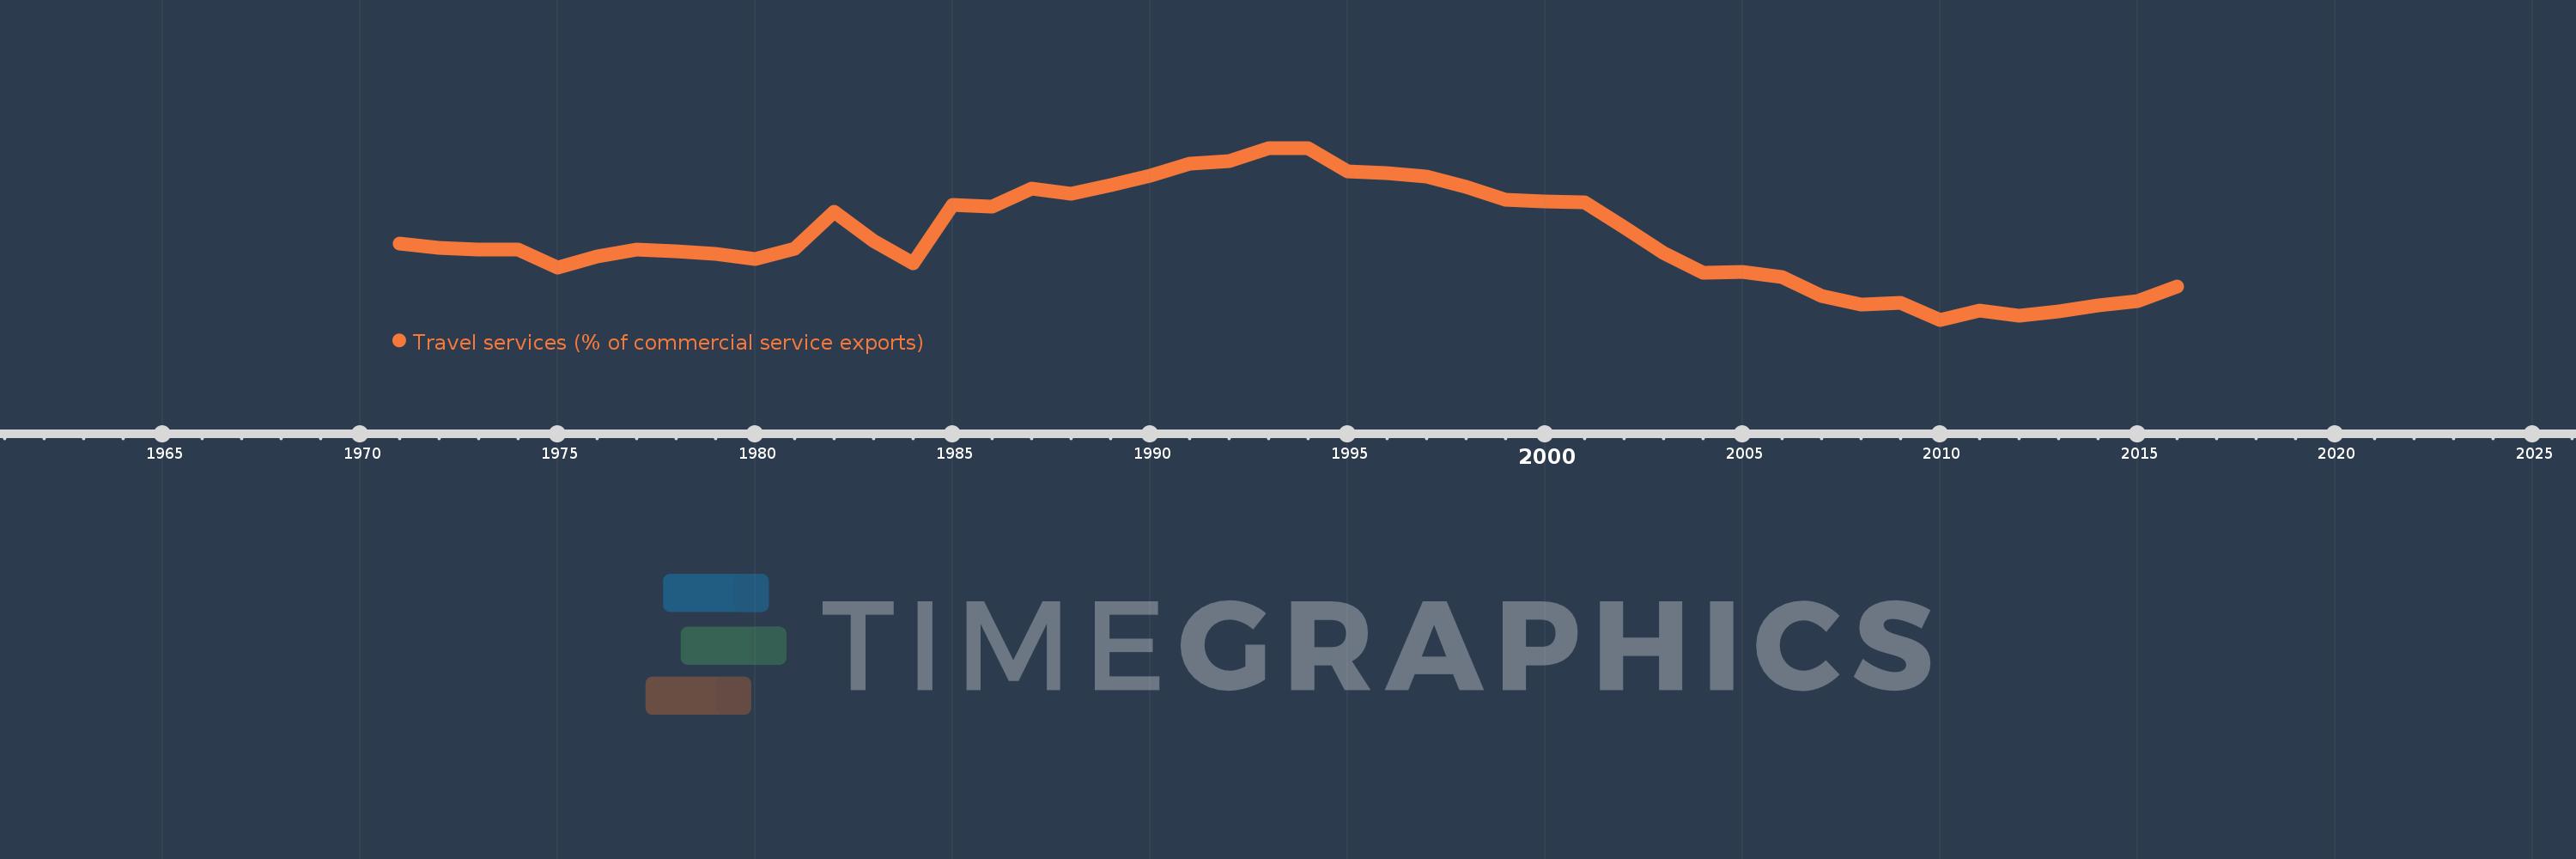
Travel services (% of commercial service exports)
2016,2015,2014,2013,2012,2011,2010,2009,2008,2007,2006,2005,2004,2003,2002,2001,2000,1999,1998,1997,1996,1995,1994,1993,1992,1991,1990,1989,1988,1987,1986,1985,1984,1983,1982,1981,1980,1979,1978,1977,1976,1975,1974,1973,1972,1971
Queste statistiche in altri paesi:
AfghanistanAlbaniaAlgeriaAngolaAntigua and BarbudaArab WorldArgentinaArmeniaArubaAustraliaAustriaAzerbaijanBahamas, TheBahrainBangladeshBarbadosBelarusBelgiumBelizeBeninBermudaBhutanBoliviaBosnia and HerzegovinaBotswanaBrazilBrunei DarussalamBulgariaBurkina FasoBurundiCabo VerdeCambodiaCameroonCanadaCaribbean small statesCentral African RepublicCentral Europe and the BalticsChadChileChinaColombiaComorosCongo, Dem. Rep.Congo, Rep.Costa RicaCote d'IvoireCroatiaCuracaoCyprusCzech RepublicDenmarkDjiboutiDominicaDominican RepublicEarly-demographic dividendEast Asia & PacificEast Asia & Pacific (excluding high income)East Asia & Pacific (IDA & IBRD countries)EcuadorEgypt, Arab Rep.El SalvadorEritreaEstoniaEthiopiaEuro areaEurope & Central AsiaEurope & Central Asia (excluding high income)Europe & Central Asia (IDA & IBRD countries)European UnionFaroe IslandsFijiFinlandFragile and conflict affected situationsFranceFrench PolynesiaGabonGambia, TheGeorgiaGermanyGhanaGreeceGrenadaGuatemalaGuineaGuinea-BissauGuyanaHaitiHeavily indebted poor countries (HIPC)High incomeHondurasHong Kong SAR, ChinaHungaryIBRD onlyIcelandIDA & IBRD totalIDA onlyIDA totalIndiaIndonesiaIran, Islamic Rep.IraqIrelandIsraelItalyJamaicaJapanJordanKazakhstanKenyaKiribatiKorea, Rep.KosovoKuwaitKyrgyz RepublicLao PDRLate-demographic dividendLatin America & Caribbean Latin America & Caribbean (excluding high income)Latin America & the Caribbean (IDA & IBRD countries)LatviaLeast developed countries: UN classificationLebanonLesothoLiberiaLibyaLithuaniaLow & middle incomeLow incomeLower middle incomeLuxembourgMacao SAR, ChinaMacedonia, FYRMadagascarMalawiMalaysiaMaldivesMaliMaltaMarshall IslandsMauritaniaMauritiusMexicoMicronesia, Fed. Sts.Middle East & North Africa (excluding high income)Middle East & North Africa (IDA & IBRD countries)Middle incomeMoldovaMongoliaMontenegroMoroccoMozambiqueMyanmarNamibiaNepalNetherlandsNew CaledoniaNew ZealandNicaraguaNigerNigeriaNorth AmericaNorwayOECD membersOmanOther small statesPacific island small statesPakistanPalauPanamaPapua New GuineaParaguayPeruPhilippinesPolandPortugalPost-demographic dividendPre-demographic dividendQatarRomaniaRussian FederationRwandaSamoaSao Tome and PrincipeSaudi ArabiaSenegalSerbiaSeychellesSierra LeoneSingaporeSint Maarten (Dutch part)Slovak RepublicSloveniaSmall statesSolomon IslandsSouth AfricaSouth AsiaSouth Asia (IDA & IBRD)South SudanSpainSri LankaSt. Kitts and NevisSt. LuciaSt. Vincent and the GrenadinesSub-Saharan Africa Sub-Saharan Africa (excluding high income)Sub-Saharan Africa (IDA & IBRD countries)SudanSurinameSwazilandSwedenSwitzerlandSyrian Arab RepublicTajikistanTanzaniaThailandTimor-LesteTogoTongaTrinidad and TobagoTunisiaTurkeyTuvaluUgandaUkraineUnited KingdomUnited StatesUpper middle incomeUruguayVanuatuVenezuela, RBWest Bank and GazaWorldYemen, Rep.ZambiaZimbabwe Linea del tempo:
Questa scala temporale mostra un grafico dal 1971 anno al 2016 anno. North America. I dati fino ad 1970 anno non disponibili. Il numero di osservazioni attuali secondo i date: 46.
La fonte (nome):
Indicatori dello sviluppo mondiale
La fonte (organizzazione):
International Monetary Fund, Balance of Payments Statistics Yearbook and data files.
Categorie:
Private Sector, Trade
sono stati aggiornati
23 apr 2017 anni
Indicatori delle variazioni dei valori per anni
Minima:
23.43
1 gen 2010 anni
Massimo:
38.442
1 gen 1994 anni
Alla data di osservazione
Valore
Variazione assoluta
La variazione rispetto al valore precedente
1 gen 1971 anni
30.058
+30.058
0.0%
1 gen 1972 anni
29.687
-0.371
-1.24%
1 gen 1973 anni
29.556
-0.131
-0.44%
1 gen 1974 anni
29.542
-0.014
-0.05%
1 gen 1975 anni
27.985
-1.556
-5.27%
1 gen 1976 anni
28.967
+0.981
3.51%
1 gen 1977 anni
29.596
+0.629
2.17%
1 gen 1978 anni
29.408
-0.188
-0.64%
1 gen 1979 anni
29.198
-0.21
-0.71%
1 gen 1980 anni
28.76
-0.438
-1.5%
1 gen 1981 anni
29.652
+0.892
3.1%
1 gen 1982 anni
32.84
+3.188
10.75%
1 gen 1983 anni
30.326
-2.513
-7.65%
1 gen 1984 anni
28.377
-1.949
-6.43%
1 gen 1985 anni
33.459
+5.082
17.91%
1 gen 1986 anni
33.284
-0.175
-0.52%
1 gen 1987 anni
34.926
+1.642
4.93%
1 gen 1988 anni
34.454
-0.472
-1.35%
1 gen 1989 anni
35.158
+0.703
2.04%
1 gen 1990 anni
36.049
+0.891
2.54%
1 gen 1991 anni
37.077
+1.028
2.85%
1 gen 1992 anni
37.299
+0.221
0.6%
1 gen 1993 anni
38.385
+1.086
2.91%
1 gen 1994 anni
38.442
+0.057
0.15%
1 gen 1995 anni
36.42
-2.022
-5.26%
1 gen 1996 anni
36.221
-0.199
-0.55%
1 gen 1997 anni
35.97
-0.251
-0.69%
1 gen 1998 anni
35.079
-0.891
-2.48%
1 gen 1999 anni
33.909
-1.171
-3.34%
1 gen 2000 anni
33.774
-0.135
-0.4%
1 gen 2001 anni
33.725
-0.049
-0.15%
1 gen 2002 anni
31.503
-2.222
-6.59%
1 gen 2003 anni
29.232
-2.271
-7.21%
1 gen 2004 anni
27.524
-1.707
-5.84%
1 gen 2005 anni
27.579
+0.054
0.2%
1 gen 2006 anni
27.176
-0.402
-1.46%
1 gen 2007 anni
25.51
-1.666
-6.13%
1 gen 2008 anni
24.753
-0.757
-2.97%
1 gen 2009 anni
24.912
+0.159
0.64%
1 gen 2010 anni
23.43
-1.481
-5.95%
1 gen 2011 anni
24.234
+0.803
3.43%
1 gen 2012 anni
23.795
-0.439
-1.81%
1 gen 2013 anni
24.19
+0.396
1.66%
1 gen 2014 anni
24.7
+0.509
2.11%
1 gen 2015 anni
25.078
+0.379
1.53%
1 gen 2016 anni
26.372
+1.293
5.16%
Classificazione dei paesi secondo i statistiche attuali per anni


Commenti: