29
/it/
it
AIzaSyAYiBZKx7MnpbEhh9jyipgxe19OcubqV5w
April 1, 2024
204841
Myanmar
MMR
true
2
1
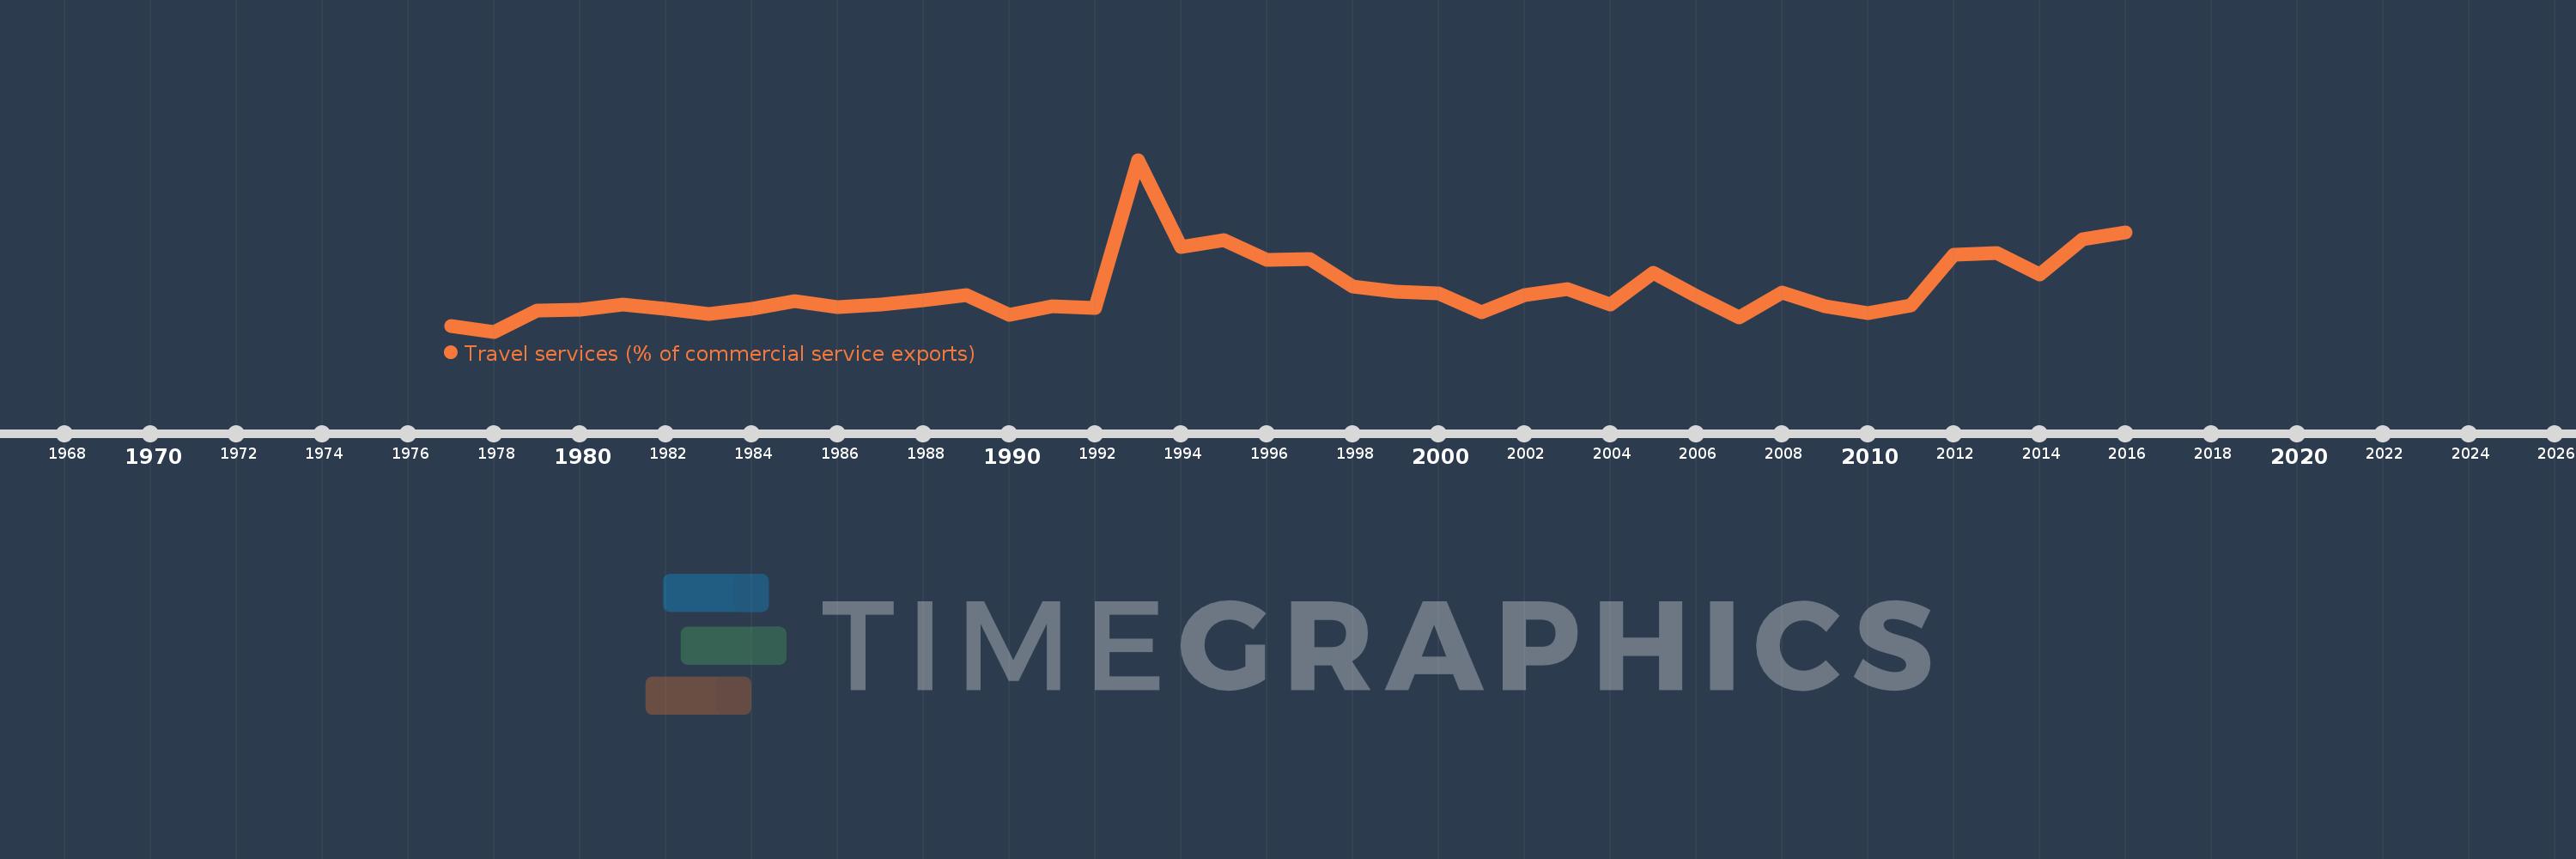
Travel services (% of commercial service exports)
2016,2015,2014,2013,2012,2011,2010,2009,2008,2007,2006,2005,2004,2003,2002,2001,2000,1999,1998,1997,1996,1995,1994,1993,1992,1991,1990,1989,1988,1987,1986,1985,1984,1983,1982,1981,1980,1979,1978,1977
Queste statistiche in altri paesi:
AfghanistanAlbaniaAlgeriaAngolaAntigua and BarbudaArab WorldArgentinaArmeniaArubaAustraliaAustriaAzerbaijanBahamas, TheBahrainBangladeshBarbadosBelarusBelgiumBelizeBeninBermudaBhutanBoliviaBosnia and HerzegovinaBotswanaBrazilBrunei DarussalamBulgariaBurkina FasoBurundiCabo VerdeCambodiaCameroonCanadaCaribbean small statesCentral African RepublicCentral Europe and the BalticsChadChileChinaColombiaComorosCongo, Dem. Rep.Congo, Rep.Costa RicaCote d'IvoireCroatiaCuracaoCyprusCzech RepublicDenmarkDjiboutiDominicaDominican RepublicEarly-demographic dividendEast Asia & PacificEast Asia & Pacific (excluding high income)East Asia & Pacific (IDA & IBRD countries)EcuadorEgypt, Arab Rep.El SalvadorEritreaEstoniaEthiopiaEuro areaEurope & Central AsiaEurope & Central Asia (excluding high income)Europe & Central Asia (IDA & IBRD countries)European UnionFaroe IslandsFijiFinlandFragile and conflict affected situationsFranceFrench PolynesiaGabonGambia, TheGeorgiaGermanyGhanaGreeceGrenadaGuatemalaGuineaGuinea-BissauGuyanaHaitiHeavily indebted poor countries (HIPC)High incomeHondurasHong Kong SAR, ChinaHungaryIBRD onlyIcelandIDA & IBRD totalIDA onlyIDA totalIndiaIndonesiaIran, Islamic Rep.IraqIrelandIsraelItalyJamaicaJapanJordanKazakhstanKenyaKiribatiKorea, Rep.KosovoKuwaitKyrgyz RepublicLao PDRLate-demographic dividendLatin America & Caribbean Latin America & Caribbean (excluding high income)Latin America & the Caribbean (IDA & IBRD countries)LatviaLeast developed countries: UN classificationLebanonLesothoLiberiaLibyaLithuaniaLow & middle incomeLow incomeLower middle incomeLuxembourgMacao SAR, ChinaMacedonia, FYRMadagascarMalawiMalaysiaMaldivesMaliMaltaMarshall IslandsMauritaniaMauritiusMexicoMicronesia, Fed. Sts.Middle East & North Africa (excluding high income)Middle East & North Africa (IDA & IBRD countries)Middle incomeMoldovaMongoliaMontenegroMoroccoMozambiqueMyanmarNamibiaNepalNetherlandsNew CaledoniaNew ZealandNicaraguaNigerNigeriaNorth AmericaNorwayOECD membersOmanOther small statesPacific island small statesPakistanPalauPanamaPapua New GuineaParaguayPeruPhilippinesPolandPortugalPost-demographic dividendPre-demographic dividendQatarRomaniaRussian FederationRwandaSamoaSao Tome and PrincipeSaudi ArabiaSenegalSerbiaSeychellesSierra LeoneSingaporeSint Maarten (Dutch part)Slovak RepublicSloveniaSmall statesSolomon IslandsSouth AfricaSouth AsiaSouth Asia (IDA & IBRD)South SudanSpainSri LankaSt. Kitts and NevisSt. LuciaSt. Vincent and the GrenadinesSub-Saharan Africa Sub-Saharan Africa (excluding high income)Sub-Saharan Africa (IDA & IBRD countries)SudanSurinameSwazilandSwedenSwitzerlandSyrian Arab RepublicTajikistanTanzaniaThailandTimor-LesteTogoTongaTrinidad and TobagoTunisiaTurkeyTuvaluUgandaUkraineUnited KingdomUnited StatesUpper middle incomeUruguayVanuatuVenezuela, RBWest Bank and GazaWorldYemen, Rep.ZambiaZimbabwe Linea del tempo:
Questa scala temporale mostra un grafico dal 1977 anno al 2016 anno. Myanmar. I dati fino ad 1976 anno non disponibili. Il numero di osservazioni attuali secondo i date: 40.
La fonte (nome):
Indicatori dello sviluppo mondiale
La fonte (organizzazione):
International Monetary Fund, Balance of Payments Statistics Yearbook and data files.
Categorie:
Private Sector, Trade
sono stati aggiornati
23 apr 2017 anni
Indicatori delle variazioni dei valori per anni
Minima:
8.988
1 gen 1978 anni
Massimo:
89.24
1 gen 1993 anni
Alla data di osservazione
Valore
Variazione assoluta
La variazione rispetto al valore precedente
1 gen 1977 anni
11.611
+11.611
0.0%
1 gen 1978 anni
8.988
-2.623
-22.59%
1 gen 1979 anni
18.785
+9.797
109.01%
1 gen 1980 anni
19.027
+0.242
1.29%
1 gen 1981 anni
21.63
+2.603
13.68%
1 gen 1982 anni
19.443
-2.187
-10.11%
1 gen 1983 anni
17.385
-2.057
-10.58%
1 gen 1984 anni
19.713
+2.327
13.39%
1 gen 1985 anni
23.09
+3.378
17.13%
1 gen 1986 anni
20.572
-2.518
-10.91%
1 gen 1987 anni
21.512
+0.94
4.57%
1 gen 1988 anni
23.602
+2.091
9.72%
1 gen 1989 anni
26.034
+2.432
10.3%
1 gen 1990 anni
16.93
-9.105
-34.97%
1 gen 1991 anni
20.87
+3.941
23.28%
1 gen 1992 anni
19.854
-1.016
-4.87%
1 gen 1993 anni
89.24
+69.386
349.48%
1 gen 1994 anni
48.369
-40.87
-45.8%
1 gen 1995 anni
51.857
+3.488
7.21%
1 gen 1996 anni
42.665
-9.192
-17.73%
1 gen 1997 anni
43.083
+0.418
0.98%
1 gen 1998 anni
30.192
-12.891
-29.92%
1 gen 1999 anni
27.726
-2.465
-8.17%
1 gen 2000 anni
26.734
-0.992
-3.58%
1 gen 2001 anni
17.873
-8.861
-33.15%
1 gen 2002 anni
26.095
+8.222
46.0%
1 gen 2003 anni
28.731
+2.636
10.1%
1 gen 2004 anni
21.52
-7.211
-25.1%
1 gen 2005 anni
36.373
+14.853
69.02%
1 gen 2006 anni
25.82
-10.553
-29.01%
1 gen 2007 anni
15.779
-10.041
-38.89%
1 gen 2008 anni
27.221
+11.442
72.51%
1 gen 2009 anni
20.813
-6.408
-23.54%
1 gen 2010 anni
17.663
-3.15
-15.14%
1 gen 2011 anni
21.308
+3.645
20.63%
1 gen 2012 anni
44.76
+23.452
110.06%
1 gen 2013 anni
45.555
+0.796
1.78%
1 gen 2014 anni
35.785
-9.77
-21.45%
1 gen 2015 anni
51.976
+16.191
45.25%
1 gen 2016 anni
55.306
+3.329
6.41%
Classificazione dei paesi secondo i statistiche attuali per anni


Commenti: