29
/it/
it
AIzaSyAYiBZKx7MnpbEhh9jyipgxe19OcubqV5w
April 1, 2024
89035
Bosnia and Herzegovina
BIH
true
2
1
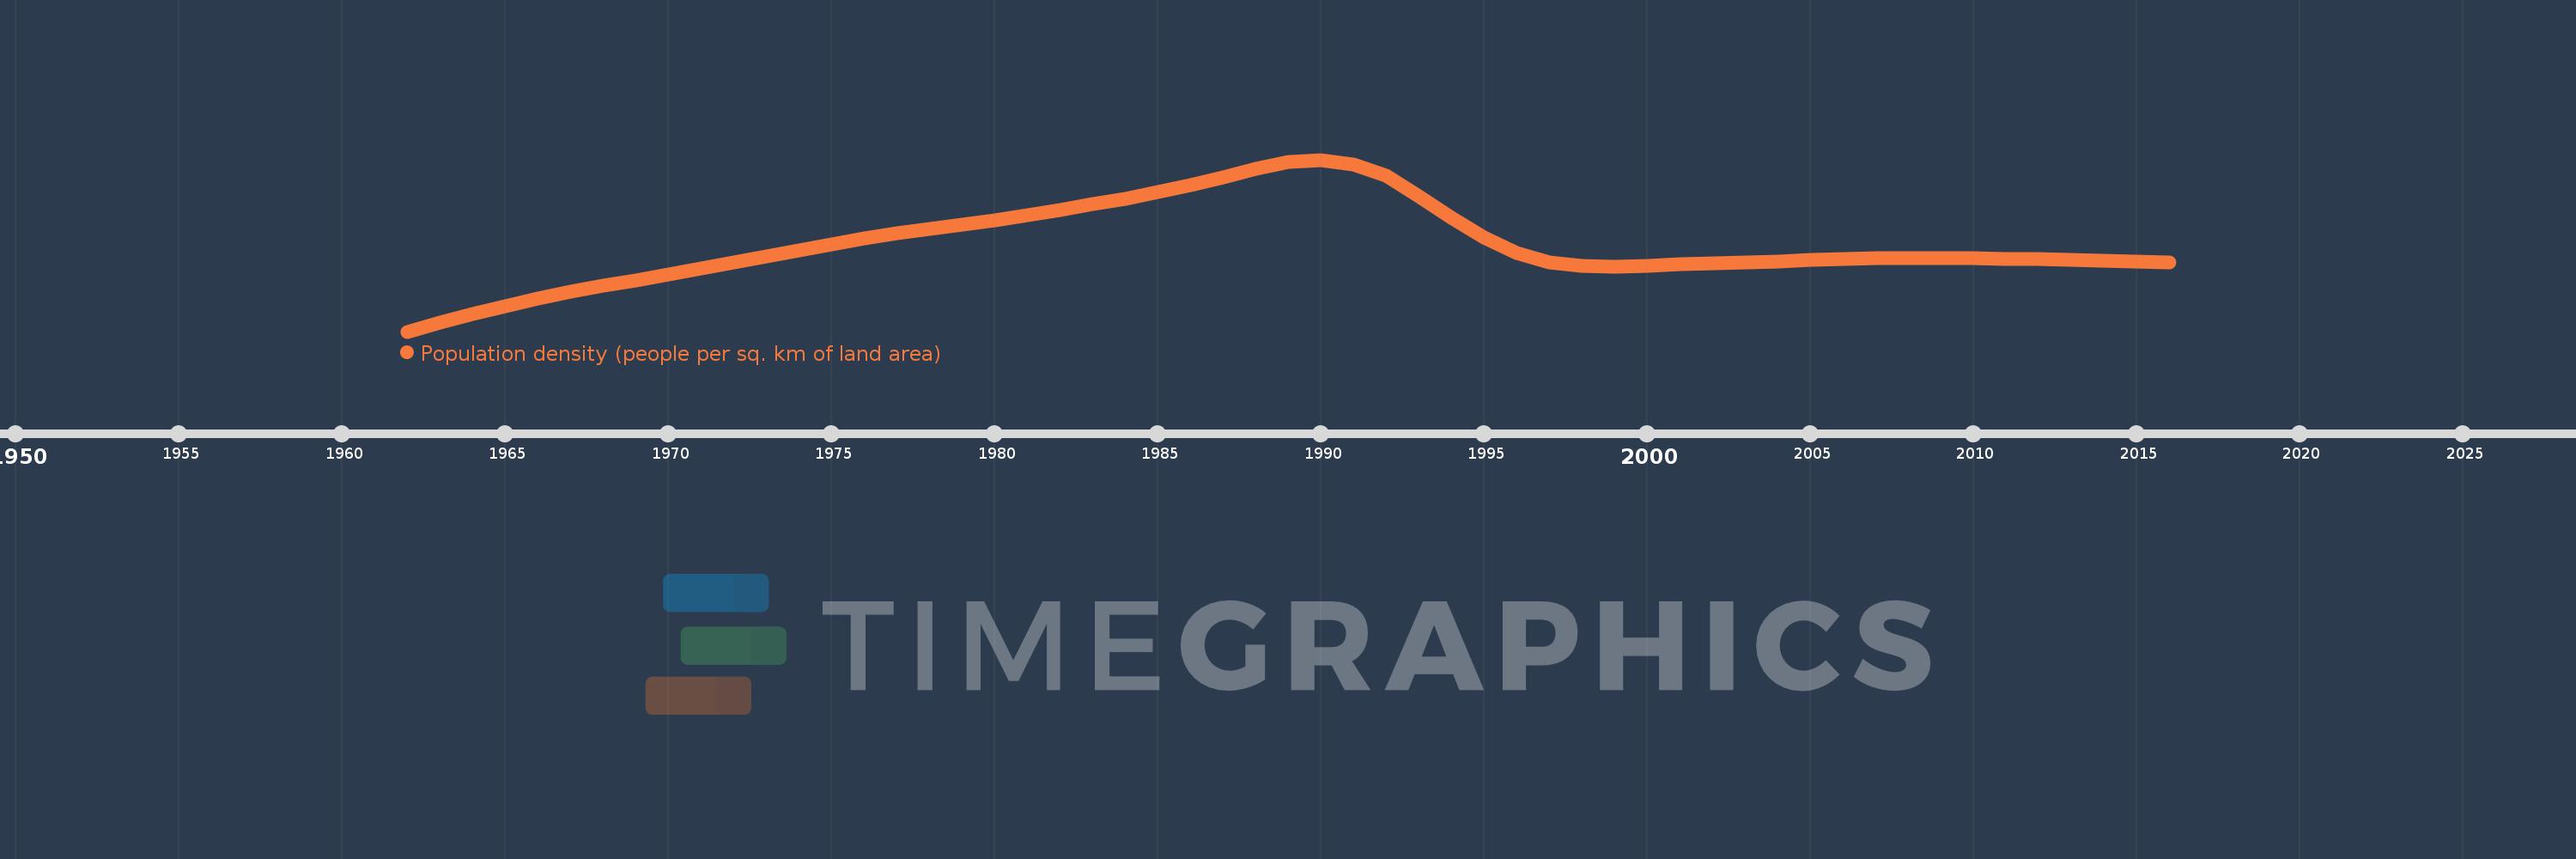
Population density (people per sq. km of land area)
2016,2015,2014,2013,2012,2011,2010,2009,2008,2007,2006,2005,2004,2003,2002,2001,2000,1999,1998,1997,1996,1995,1994,1993,1992,1991,1990,1989,1988,1987,1986,1985,1984,1983,1982,1981,1980,1979,1978,1977,1976,1975,1974,1973,1972,1971,1970,1969,1968,1967,1966,1965,1964,1963,1962
Queste statistiche in altri paesi:
AfghanistanAlbaniaAlgeriaAmerican SamoaAndorraAngolaAntigua and BarbudaArab WorldArgentinaArmeniaArubaAustraliaAustriaAzerbaijanBahamas, TheBahrainBangladeshBarbadosBelarusBelgiumBelizeBeninBermudaBhutanBoliviaBosnia and HerzegovinaBotswanaBrazilBritish Virgin IslandsBrunei DarussalamBulgariaBurkina FasoBurundiCabo VerdeCambodiaCameroonCanadaCaribbean small statesCayman IslandsCentral African RepublicCentral Europe and the BalticsChadChannel IslandsChileChinaColombiaComorosCongo, Dem. Rep.Congo, Rep.Costa RicaCote d'IvoireCroatiaCubaCuracaoCyprusCzech RepublicDenmarkDjiboutiDominicaDominican RepublicEarly-demographic dividendEast Asia & PacificEast Asia & Pacific (excluding high income)East Asia & Pacific (IDA & IBRD countries)EcuadorEgypt, Arab Rep.El SalvadorEquatorial GuineaEritreaEstoniaEthiopiaEuro areaEurope & Central AsiaEurope & Central Asia (excluding high income)Europe & Central Asia (IDA & IBRD countries)European UnionFaroe IslandsFijiFinlandFragile and conflict affected situationsFranceFrench PolynesiaGabonGambia, TheGeorgiaGermanyGhanaGibraltarGreeceGreenlandGrenadaGuamGuatemalaGuineaGuinea-BissauGuyanaHaitiHeavily indebted poor countries (HIPC)High incomeHondurasHong Kong SAR, ChinaHungaryIBRD onlyIcelandIDA & IBRD totalIDA blendIDA onlyIDA totalIndiaIndonesiaIran, Islamic Rep.IraqIrelandIsle of ManIsraelItalyJamaicaJapanJordanKazakhstanKenyaKiribatiKorea, Dem. People’s Rep.Korea, Rep.KosovoKuwaitKyrgyz RepublicLao PDRLate-demographic dividendLatin America & Caribbean Latin America & Caribbean (excluding high income)Latin America & the Caribbean (IDA & IBRD countries)LatviaLeast developed countries: UN classificationLebanonLesothoLiberiaLibyaLiechtensteinLithuaniaLow & middle incomeLow incomeLower middle incomeLuxembourgMacao SAR, ChinaMacedonia, FYRMadagascarMalawiMalaysiaMaldivesMaliMaltaMarshall IslandsMauritaniaMauritiusMexicoMicronesia, Fed. Sts.Middle East & North AfricaMiddle East & North Africa (excluding high income)Middle East & North Africa (IDA & IBRD countries)Middle incomeMoldovaMonacoMongoliaMontenegroMoroccoMozambiqueMyanmarNamibiaNauruNepalNetherlandsNew CaledoniaNew ZealandNicaraguaNigerNigeriaNorth AmericaNorthern Mariana IslandsNorwayOECD membersOmanOther small statesPacific island small statesPakistanPalauPanamaPapua New GuineaParaguayPeruPhilippinesPolandPortugalPost-demographic dividendPre-demographic dividendPuerto RicoQatarRomaniaRussian FederationRwandaSamoaSan MarinoSao Tome and PrincipeSaudi ArabiaSenegalSerbiaSeychellesSierra LeoneSingaporeSint Maarten (Dutch part)Slovak RepublicSloveniaSmall statesSolomon IslandsSomaliaSouth AfricaSouth AsiaSouth Asia (IDA & IBRD)SpainSri LankaSt. Kitts and NevisSt. LuciaSt. Martin (French part)St. Vincent and the GrenadinesSub-Saharan Africa Sub-Saharan Africa (excluding high income)Sub-Saharan Africa (IDA & IBRD countries)SudanSurinameSwazilandSwedenSwitzerlandSyrian Arab RepublicTajikistanTanzaniaThailandTimor-LesteTogoTongaTrinidad and TobagoTunisiaTurkeyTurkmenistanTurks and Caicos IslandsTuvaluUgandaUkraineUnited Arab EmiratesUnited KingdomUnited StatesUpper middle incomeUruguayUzbekistanVanuatuVenezuela, RBVietnamVirgin Islands (U.S.)West Bank and GazaWorldYemen, Rep.ZambiaZimbabwe Linea del tempo:
Questa scala temporale mostra un grafico dal 1962 anno al 2016 anno. Bosnia and Herzegovina. I dati fino ad 1961 anno non disponibili. Il numero di osservazioni attuali secondo i date: 55.
La fonte (nome):
Indicatori dello sviluppo mondiale
La fonte (organizzazione):
Food and Agriculture Organization and World Bank population estimates.
Categorie:
Urban Development
sono stati aggiornati
23 apr 2017 anni
Indicatori delle variazioni dei valori per anni
Minima:
64.257
1 gen 1962 anni
Massimo:
89.397
1 gen 1990 anni
Alla data di osservazione
Valore
Variazione assoluta
La variazione rispetto al valore precedente
1 gen 1962 anni
64.257
+64.257
0.0%
1 gen 1963 anni
65.526
+1.269
1.97%
1 gen 1964 anni
66.793
+1.268
1.93%
1 gen 1965 anni
68.002
+1.208
1.81%
1 gen 1966 anni
69.11
+1.108
1.63%
1 gen 1967 anni
70.097
+0.988
1.43%
1 gen 1968 anni
70.98
+0.883
1.26%
1 gen 1969 anni
71.797
+0.817
1.15%
1 gen 1970 anni
72.605
+0.808
1.12%
1 gen 1971 anni
73.444
+0.839
1.16%
1 gen 1972 anni
74.332
+0.888
1.21%
1 gen 1973 anni
75.255
+0.923
1.24%
1 gen 1974 anni
76.181
+0.926
1.23%
1 gen 1975 anni
77.064
+0.883
1.16%
1 gen 1976 anni
77.875
+0.81
1.05%
1 gen 1977 anni
78.596
+0.722
0.93%
1 gen 1978 anni
79.248
+0.651
0.83%
1 gen 1979 anni
79.872
+0.625
0.79%
1 gen 1980 anni
80.532
+0.66
0.83%
1 gen 1981 anni
81.269
+0.737
0.92%
1 gen 1982 anni
82.06
+0.791
0.97%
1 gen 1983 anni
82.876
+0.815
0.99%
1 gen 1984 anni
83.737
+0.861
1.04%
1 gen 1985 anni
84.673
+0.935
1.12%
1 gen 1986 anni
85.677
+1.004
1.19%
1 gen 1987 anni
86.833
+1.156
1.35%
1 gen 1988 anni
88.073
+1.241
1.43%
1 gen 1989 anni
89.074
+1.0
1.14%
1 gen 1990 anni
89.397
+0.324
0.36%
1 gen 1991 anni
88.765
-0.633
-0.71%
1 gen 1992 anni
87.018
-1.747
-1.97%
1 gen 1993 anni
84.007
-3.01
-3.46%
1 gen 1994 anni
80.882
-3.125
-3.72%
1 gen 1995 anni
77.974
-2.908
-3.6%
1 gen 1996 anni
75.767
-2.207
-2.83%
1 gen 1997 anni
74.427
-1.34
-1.77%
1 gen 1998 anni
73.816
-0.611
-0.82%
1 gen 1999 anni
73.748
-0.067
-0.09%
1 gen 2000 anni
73.914
+0.166
0.22%
1 gen 2001 anni
74.08
+0.166
0.22%
1 gen 2002 anni
74.214
+0.134
0.18%
1 gen 2003 anni
74.382
+0.168
0.23%
1 gen 2004 anni
74.557
+0.175
0.24%
1 gen 2005 anni
74.724
+0.167
0.22%
1 gen 2006 anni
74.871
+0.147
0.2%
1 gen 2007 anni
74.971
+0.1
0.13%
1 gen 2008 anni
75.008
+0.037
0.05%
1 gen 2009 anni
74.995
-0.013
-0.02%
1 gen 2010 anni
74.956
-0.039
-0.05%
1 gen 2011 anni
74.907
-0.048
-0.06%
1 gen 2012 anni
74.85
-0.058
-0.08%
1 gen 2013 anni
74.774
-0.076
-0.1%
1 gen 2014 anni
74.678
-0.095
-0.13%
1 gen 2015 anni
74.562
-0.117
-0.16%
1 gen 2016 anni
74.422
-0.139
-0.19%
Classificazione dei paesi secondo i statistiche attuali per anni


Commenti: