29
/it/
it
AIzaSyAYiBZKx7MnpbEhh9jyipgxe19OcubqV5w
April 1, 2024
221347
Paraguay
PRY
true
2
1
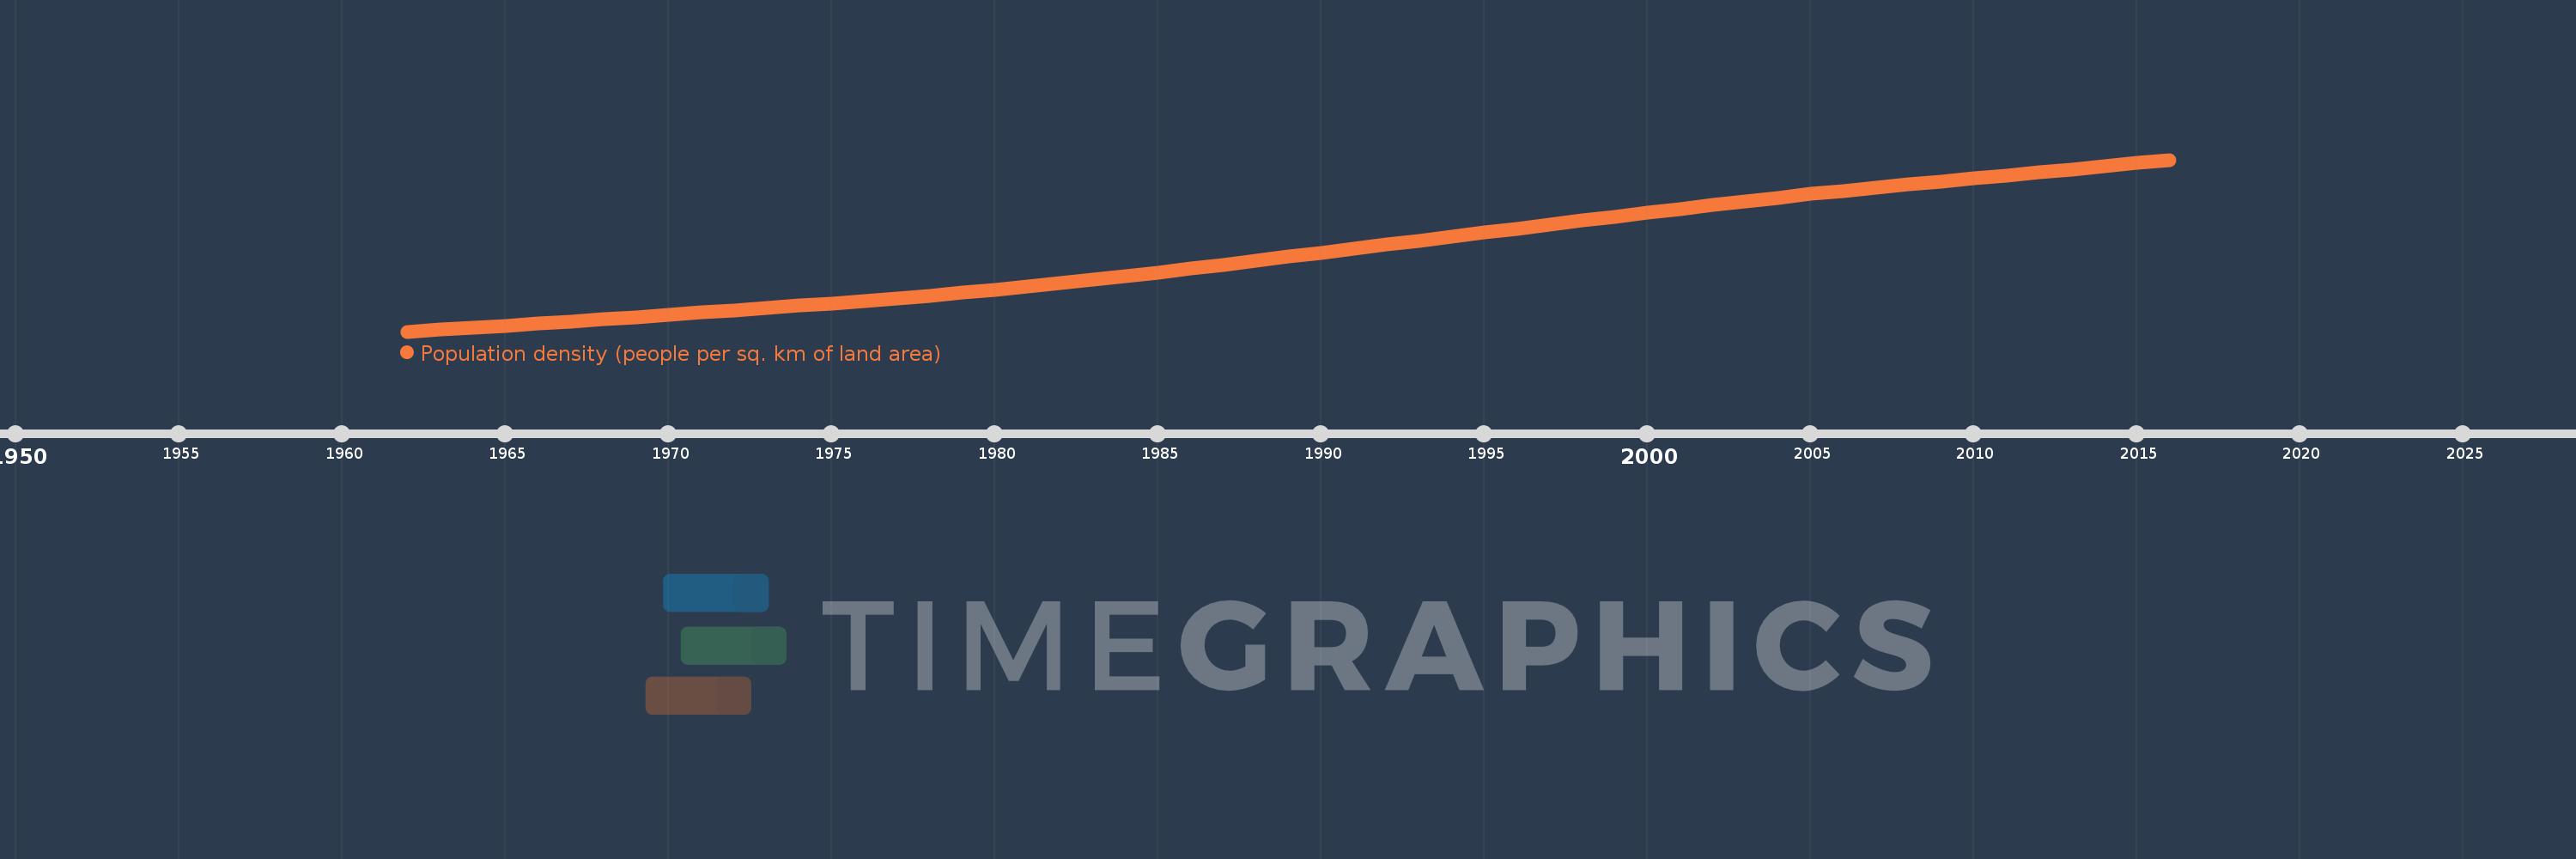
Population density (people per sq. km of land area)
2016,2015,2014,2013,2012,2011,2010,2009,2008,2007,2006,2005,2004,2003,2002,2001,2000,1999,1998,1997,1996,1995,1994,1993,1992,1991,1990,1989,1988,1987,1986,1985,1984,1983,1982,1981,1980,1979,1978,1977,1976,1975,1974,1973,1972,1971,1970,1969,1968,1967,1966,1965,1964,1963,1962
Queste statistiche in altri paesi:
AfghanistanAlbaniaAlgeriaAmerican SamoaAndorraAngolaAntigua and BarbudaArab WorldArgentinaArmeniaArubaAustraliaAustriaAzerbaijanBahamas, TheBahrainBangladeshBarbadosBelarusBelgiumBelizeBeninBermudaBhutanBoliviaBosnia and HerzegovinaBotswanaBrazilBritish Virgin IslandsBrunei DarussalamBulgariaBurkina FasoBurundiCabo VerdeCambodiaCameroonCanadaCaribbean small statesCayman IslandsCentral African RepublicCentral Europe and the BalticsChadChannel IslandsChileChinaColombiaComorosCongo, Dem. Rep.Congo, Rep.Costa RicaCote d'IvoireCroatiaCubaCuracaoCyprusCzech RepublicDenmarkDjiboutiDominicaDominican RepublicEarly-demographic dividendEast Asia & PacificEast Asia & Pacific (excluding high income)East Asia & Pacific (IDA & IBRD countries)EcuadorEgypt, Arab Rep.El SalvadorEquatorial GuineaEritreaEstoniaEthiopiaEuro areaEurope & Central AsiaEurope & Central Asia (excluding high income)Europe & Central Asia (IDA & IBRD countries)European UnionFaroe IslandsFijiFinlandFragile and conflict affected situationsFranceFrench PolynesiaGabonGambia, TheGeorgiaGermanyGhanaGibraltarGreeceGreenlandGrenadaGuamGuatemalaGuineaGuinea-BissauGuyanaHaitiHeavily indebted poor countries (HIPC)High incomeHondurasHong Kong SAR, ChinaHungaryIBRD onlyIcelandIDA & IBRD totalIDA blendIDA onlyIDA totalIndiaIndonesiaIran, Islamic Rep.IraqIrelandIsle of ManIsraelItalyJamaicaJapanJordanKazakhstanKenyaKiribatiKorea, Dem. People’s Rep.Korea, Rep.KosovoKuwaitKyrgyz RepublicLao PDRLate-demographic dividendLatin America & Caribbean Latin America & Caribbean (excluding high income)Latin America & the Caribbean (IDA & IBRD countries)LatviaLeast developed countries: UN classificationLebanonLesothoLiberiaLibyaLiechtensteinLithuaniaLow & middle incomeLow incomeLower middle incomeLuxembourgMacao SAR, ChinaMacedonia, FYRMadagascarMalawiMalaysiaMaldivesMaliMaltaMarshall IslandsMauritaniaMauritiusMexicoMicronesia, Fed. Sts.Middle East & North AfricaMiddle East & North Africa (excluding high income)Middle East & North Africa (IDA & IBRD countries)Middle incomeMoldovaMonacoMongoliaMontenegroMoroccoMozambiqueMyanmarNamibiaNauruNepalNetherlandsNew CaledoniaNew ZealandNicaraguaNigerNigeriaNorth AmericaNorthern Mariana IslandsNorwayOECD membersOmanOther small statesPacific island small statesPakistanPalauPanamaPapua New GuineaParaguayPeruPhilippinesPolandPortugalPost-demographic dividendPre-demographic dividendPuerto RicoQatarRomaniaRussian FederationRwandaSamoaSan MarinoSao Tome and PrincipeSaudi ArabiaSenegalSerbiaSeychellesSierra LeoneSingaporeSint Maarten (Dutch part)Slovak RepublicSloveniaSmall statesSolomon IslandsSomaliaSouth AfricaSouth AsiaSouth Asia (IDA & IBRD)SpainSri LankaSt. Kitts and NevisSt. LuciaSt. Martin (French part)St. Vincent and the GrenadinesSub-Saharan Africa Sub-Saharan Africa (excluding high income)Sub-Saharan Africa (IDA & IBRD countries)SudanSurinameSwazilandSwedenSwitzerlandSyrian Arab RepublicTajikistanTanzaniaThailandTimor-LesteTogoTongaTrinidad and TobagoTunisiaTurkeyTurkmenistanTurks and Caicos IslandsTuvaluUgandaUkraineUnited Arab EmiratesUnited KingdomUnited StatesUpper middle incomeUruguayUzbekistanVanuatuVenezuela, RBVietnamVirgin Islands (U.S.)West Bank and GazaWorldYemen, Rep.ZambiaZimbabwe Linea del tempo:
Questa scala temporale mostra un grafico dal 1962 anno al 2016 anno. Paraguay. I dati fino ad 1961 anno non disponibili. Il numero di osservazioni attuali secondo i date: 55.
La fonte (nome):
Indicatori dello sviluppo mondiale
La fonte (organizzazione):
Food and Agriculture Organization and World Bank population estimates.
Categorie:
Urban Development
sono stati aggiornati
23 apr 2017 anni
Indicatori delle variazioni dei valori per anni
Minima:
4.917
1 gen 1962 anni
Massimo:
16.711
1 gen 2016 anni
Alla data di osservazione
Valore
Variazione assoluta
La variazione rispetto al valore precedente
1 gen 1962 anni
4.917
+4.917
0.0%
1 gen 1963 anni
5.047
+0.131
2.66%
1 gen 1964 anni
5.182
+0.135
2.67%
1 gen 1965 anni
5.321
+0.139
2.68%
1 gen 1966 anni
5.464
+0.143
2.68%
1 gen 1967 anni
5.611
+0.147
2.7%
1 gen 1968 anni
5.763
+0.152
2.7%
1 gen 1969 anni
5.917
+0.154
2.68%
1 gen 1970 anni
6.072
+0.155
2.62%
1 gen 1971 anni
6.227
+0.155
2.55%
1 gen 1972 anni
6.381
+0.154
2.48%
1 gen 1973 anni
6.536
+0.155
2.42%
1 gen 1974 anni
6.693
+0.157
2.4%
1 gen 1975 anni
6.855
+0.162
2.42%
1 gen 1976 anni
7.025
+0.17
2.48%
1 gen 1977 anni
7.203
+0.178
2.53%
1 gen 1978 anni
7.388
+0.186
2.58%
1 gen 1979 anni
7.583
+0.195
2.64%
1 gen 1980 anni
7.789
+0.206
2.71%
1 gen 1981 anni
8.006
+0.217
2.78%
1 gen 1982 anni
8.234
+0.229
2.86%
1 gen 1983 anni
8.474
+0.24
2.91%
1 gen 1984 anni
8.723
+0.249
2.94%
1 gen 1985 anni
8.98
+0.257
2.94%
1 gen 1986 anni
9.242
+0.262
2.92%
1 gen 1987 anni
9.509
+0.267
2.89%
1 gen 1988 anni
9.78
+0.271
2.85%
1 gen 1989 anni
10.054
+0.274
2.8%
1 gen 1990 anni
10.329
+0.276
2.74%
1 gen 1991 anni
10.606
+0.276
2.68%
1 gen 1992 anni
10.882
+0.276
2.6%
1 gen 1993 anni
11.157
+0.275
2.53%
1 gen 1994 anni
11.432
+0.275
2.46%
1 gen 1995 anni
11.707
+0.275
2.41%
1 gen 1996 anni
11.983
+0.276
2.36%
1 gen 1997 anni
12.259
+0.276
2.31%
1 gen 1998 anni
12.535
+0.276
2.25%
1 gen 1999 anni
12.81
+0.274
2.19%
1 gen 2000 anni
13.081
+0.271
2.11%
1 gen 2001 anni
13.347
+0.266
2.04%
1 gen 2002 anni
13.608
+0.262
1.96%
1 gen 2003 anni
13.865
+0.257
1.89%
1 gen 2004 anni
14.115
+0.25
1.8%
1 gen 2005 anni
14.356
+0.241
1.71%
1 gen 2006 anni
14.587
+0.231
1.61%
1 gen 2007 anni
14.807
+0.22
1.51%
1 gen 2008 anni
15.017
+0.21
1.42%
1 gen 2009 anni
15.221
+0.204
1.36%
1 gen 2010 anni
15.424
+0.203
1.33%
1 gen 2011 anni
15.63
+0.206
1.34%
1 gen 2012 anni
15.841
+0.211
1.35%
1 gen 2013 anni
16.056
+0.215
1.36%
1 gen 2014 anni
16.274
+0.218
1.36%
1 gen 2015 anni
16.493
+0.219
1.34%
1 gen 2016 anni
16.711
+0.218
1.32%
Classificazione dei paesi secondo i statistiche attuali per anni


Commenti: