29
/it/
it
AIzaSyAYiBZKx7MnpbEhh9jyipgxe19OcubqV5w
April 1, 2024
283302
Virgin Islands (U.S.)
VIR
true
2
1
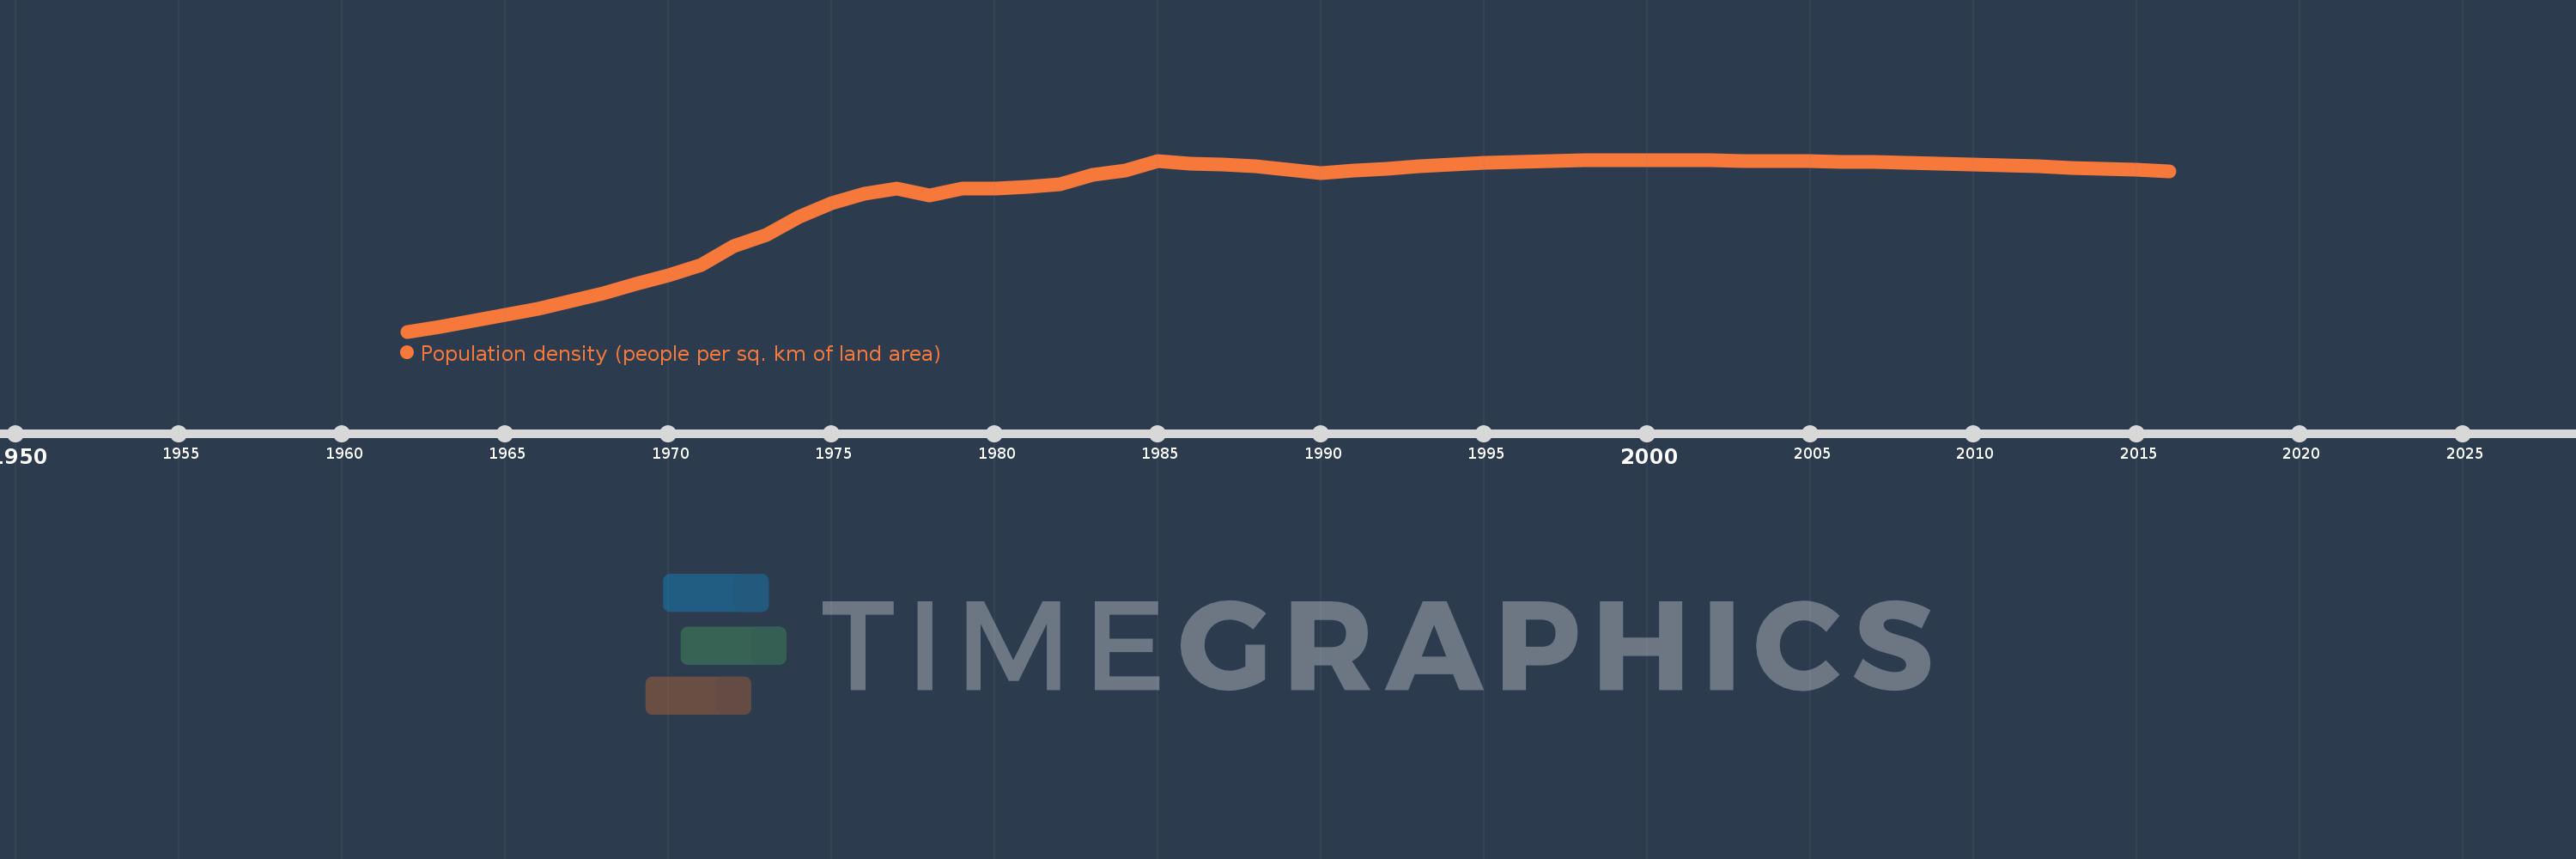
Population density (people per sq. km of land area)
2016,2015,2014,2013,2012,2011,2010,2009,2008,2007,2006,2005,2004,2003,2002,2001,2000,1999,1998,1997,1996,1995,1994,1993,1992,1991,1990,1989,1988,1987,1986,1985,1984,1983,1982,1981,1980,1979,1978,1977,1976,1975,1974,1973,1972,1971,1970,1969,1968,1967,1966,1965,1964,1963,1962
Queste statistiche in altri paesi:
AfghanistanAlbaniaAlgeriaAmerican SamoaAndorraAngolaAntigua and BarbudaArab WorldArgentinaArmeniaArubaAustraliaAustriaAzerbaijanBahamas, TheBahrainBangladeshBarbadosBelarusBelgiumBelizeBeninBermudaBhutanBoliviaBosnia and HerzegovinaBotswanaBrazilBritish Virgin IslandsBrunei DarussalamBulgariaBurkina FasoBurundiCabo VerdeCambodiaCameroonCanadaCaribbean small statesCayman IslandsCentral African RepublicCentral Europe and the BalticsChadChannel IslandsChileChinaColombiaComorosCongo, Dem. Rep.Congo, Rep.Costa RicaCote d'IvoireCroatiaCubaCuracaoCyprusCzech RepublicDenmarkDjiboutiDominicaDominican RepublicEarly-demographic dividendEast Asia & PacificEast Asia & Pacific (excluding high income)East Asia & Pacific (IDA & IBRD countries)EcuadorEgypt, Arab Rep.El SalvadorEquatorial GuineaEritreaEstoniaEthiopiaEuro areaEurope & Central AsiaEurope & Central Asia (excluding high income)Europe & Central Asia (IDA & IBRD countries)European UnionFaroe IslandsFijiFinlandFragile and conflict affected situationsFranceFrench PolynesiaGabonGambia, TheGeorgiaGermanyGhanaGibraltarGreeceGreenlandGrenadaGuamGuatemalaGuineaGuinea-BissauGuyanaHaitiHeavily indebted poor countries (HIPC)High incomeHondurasHong Kong SAR, ChinaHungaryIBRD onlyIcelandIDA & IBRD totalIDA blendIDA onlyIDA totalIndiaIndonesiaIran, Islamic Rep.IraqIrelandIsle of ManIsraelItalyJamaicaJapanJordanKazakhstanKenyaKiribatiKorea, Dem. People’s Rep.Korea, Rep.KosovoKuwaitKyrgyz RepublicLao PDRLate-demographic dividendLatin America & Caribbean Latin America & Caribbean (excluding high income)Latin America & the Caribbean (IDA & IBRD countries)LatviaLeast developed countries: UN classificationLebanonLesothoLiberiaLibyaLiechtensteinLithuaniaLow & middle incomeLow incomeLower middle incomeLuxembourgMacao SAR, ChinaMacedonia, FYRMadagascarMalawiMalaysiaMaldivesMaliMaltaMarshall IslandsMauritaniaMauritiusMexicoMicronesia, Fed. Sts.Middle East & North AfricaMiddle East & North Africa (excluding high income)Middle East & North Africa (IDA & IBRD countries)Middle incomeMoldovaMonacoMongoliaMontenegroMoroccoMozambiqueMyanmarNamibiaNauruNepalNetherlandsNew CaledoniaNew ZealandNicaraguaNigerNigeriaNorth AmericaNorthern Mariana IslandsNorwayOECD membersOmanOther small statesPacific island small statesPakistanPalauPanamaPapua New GuineaParaguayPeruPhilippinesPolandPortugalPost-demographic dividendPre-demographic dividendPuerto RicoQatarRomaniaRussian FederationRwandaSamoaSan MarinoSao Tome and PrincipeSaudi ArabiaSenegalSerbiaSeychellesSierra LeoneSingaporeSint Maarten (Dutch part)Slovak RepublicSloveniaSmall statesSolomon IslandsSomaliaSouth AfricaSouth AsiaSouth Asia (IDA & IBRD)SpainSri LankaSt. Kitts and NevisSt. LuciaSt. Martin (French part)St. Vincent and the GrenadinesSub-Saharan Africa Sub-Saharan Africa (excluding high income)Sub-Saharan Africa (IDA & IBRD countries)SudanSurinameSwazilandSwedenSwitzerlandSyrian Arab RepublicTajikistanTanzaniaThailandTimor-LesteTogoTongaTrinidad and TobagoTunisiaTurkeyTurkmenistanTurks and Caicos IslandsTuvaluUgandaUkraineUnited Arab EmiratesUnited KingdomUnited StatesUpper middle incomeUruguayUzbekistanVanuatuVenezuela, RBVietnamVirgin Islands (U.S.)West Bank and GazaWorldYemen, Rep.ZambiaZimbabwe Linea del tempo:
Questa scala temporale mostra un grafico dal 1962 anno al 2016 anno. Virgin Islands (U.S.). I dati fino ad 1961 anno non disponibili. Il numero di osservazioni attuali secondo i date: 55.
La fonte (nome):
Indicatori dello sviluppo mondiale
La fonte (organizzazione):
Food and Agriculture Organization and World Bank population estimates.
Categorie:
Urban Development
sono stati aggiornati
23 apr 2017 anni
Indicatori delle variazioni dei valori per anni
Minima:
97.429
1 gen 1962 anni
Massimo:
310.397
1 gen 2001 anni
Alla data di osservazione
Valore
Variazione assoluta
La variazione rispetto al valore precedente
1 gen 1962 anni
97.429
+97.429
0.0%
1 gen 1963 anni
103.714
+6.286
6.45%
1 gen 1964 anni
110.571
+6.857
6.61%
1 gen 1965 anni
118.0
+7.429
6.72%
1 gen 1966 anni
125.714
+7.714
6.54%
1 gen 1967 anni
135.143
+9.429
7.5%
1 gen 1968 anni
145.143
+10.0
7.4%
1 gen 1969 anni
156.0
+10.857
7.48%
1 gen 1970 anni
167.429
+11.429
7.33%
1 gen 1971 anni
180.0
+12.571
7.51%
1 gen 1972 anni
202.857
+22.857
12.7%
1 gen 1973 anni
217.143
+14.286
7.04%
1 gen 1974 anni
240.0
+22.857
10.53%
1 gen 1975 anni
257.143
+17.143
7.14%
1 gen 1976 anni
268.571
+11.429
4.44%
1 gen 1977 anni
274.286
+5.714
2.13%
1 gen 1978 anni
265.714
-8.571
-3.12%
1 gen 1979 anni
274.286
+8.571
3.23%
1 gen 1980 anni
274.286
0.0
0.0%
1 gen 1981 anni
277.143
+2.857
1.04%
1 gen 1982 anni
280.0
+2.857
1.03%
1 gen 1983 anni
291.429
+11.429
4.08%
1 gen 1984 anni
297.143
+5.714
1.96%
1 gen 1985 anni
308.571
+11.429
3.85%
1 gen 1986 anni
305.714
-2.857
-0.93%
1 gen 1987 anni
304.286
-1.429
-0.47%
1 gen 1988 anni
302.857
-1.429
-0.47%
1 gen 1989 anni
298.571
-4.286
-1.42%
1 gen 1990 anni
294.286
-4.286
-1.44%
1 gen 1991 anni
297.037
+2.751
0.93%
1 gen 1992 anni
299.449
+2.411
0.81%
1 gen 1993 anni
302.031
+2.583
0.86%
1 gen 1994 anni
304.506
+2.474
0.82%
1 gen 1995 anni
306.62
+2.114
0.69%
1 gen 1996 anni
308.049
+1.429
0.47%
1 gen 1997 anni
308.837
+0.789
0.26%
1 gen 1998 anni
309.586
+0.749
0.24%
1 gen 1999 anni
310.1
+0.514
0.17%
1 gen 2000 anni
310.274
+0.174
0.06%
1 gen 2001 anni
310.397
+0.123
0.04%
1 gen 2002 anni
309.674
-0.723
-0.23%
1 gen 2003 anni
309.166
-0.509
-0.16%
1 gen 2004 anni
308.814
-0.351
-0.11%
1 gen 2005 anni
308.429
-0.386
-0.12%
1 gen 2006 anni
308.18
-0.249
-0.08%
1 gen 2007 anni
307.714
-0.466
-0.15%
1 gen 2008 anni
306.923
-0.791
-0.26%
1 gen 2009 anni
305.974
-0.949
-0.31%
1 gen 2010 anni
304.877
-1.097
-0.36%
1 gen 2011 anni
303.62
-1.257
-0.41%
1 gen 2012 anni
302.24
-1.38
-0.45%
1 gen 2013 anni
300.786
-1.454
-0.48%
1 gen 2014 anni
299.249
-1.537
-0.51%
1 gen 2015 anni
297.629
-1.62
-0.54%
1 gen 2016 anni
295.926
-1.703
-0.57%
Classificazione dei paesi secondo i statistiche attuali per anni


Commenti: