29
/it/
it
AIzaSyAYiBZKx7MnpbEhh9jyipgxe19OcubqV5w
April 1, 2024
62943
World
WLD
false
2
1
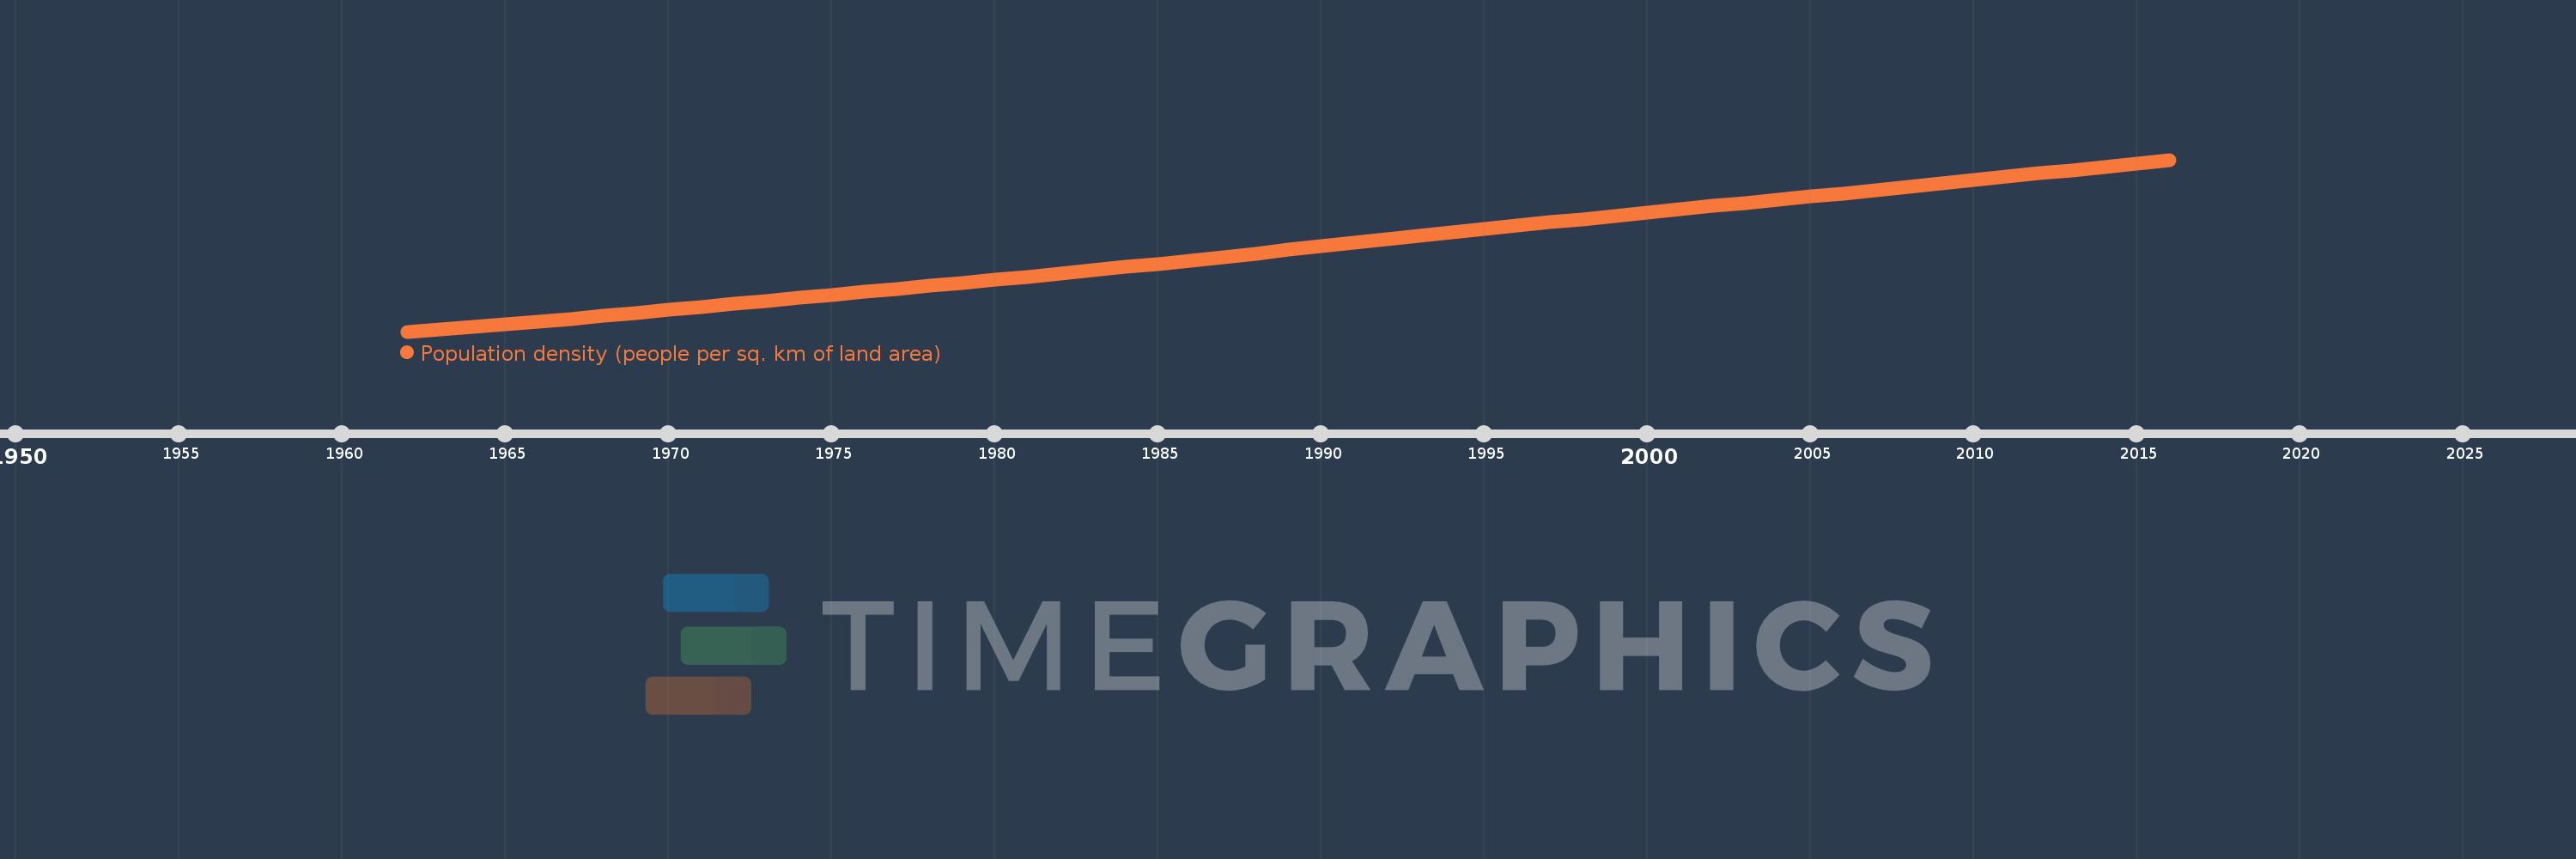
Population density (people per sq. km of land area)
2016,2015,2014,2013,2012,2011,2010,2009,2008,2007,2006,2005,2004,2003,2002,2001,2000,1999,1998,1997,1996,1995,1994,1993,1992,1991,1990,1989,1988,1987,1986,1985,1984,1983,1982,1981,1980,1979,1978,1977,1976,1975,1974,1973,1972,1971,1970,1969,1968,1967,1966,1965,1964,1963,1962
Queste statistiche in altri paesi:
AfghanistanAlbaniaAlgeriaAmerican SamoaAndorraAngolaAntigua and BarbudaArab WorldArgentinaArmeniaArubaAustraliaAustriaAzerbaijanBahamas, TheBahrainBangladeshBarbadosBelarusBelgiumBelizeBeninBermudaBhutanBoliviaBosnia and HerzegovinaBotswanaBrazilBritish Virgin IslandsBrunei DarussalamBulgariaBurkina FasoBurundiCabo VerdeCambodiaCameroonCanadaCaribbean small statesCayman IslandsCentral African RepublicCentral Europe and the BalticsChadChannel IslandsChileChinaColombiaComorosCongo, Dem. Rep.Congo, Rep.Costa RicaCote d'IvoireCroatiaCubaCuracaoCyprusCzech RepublicDenmarkDjiboutiDominicaDominican RepublicEarly-demographic dividendEast Asia & PacificEast Asia & Pacific (excluding high income)East Asia & Pacific (IDA & IBRD countries)EcuadorEgypt, Arab Rep.El SalvadorEquatorial GuineaEritreaEstoniaEthiopiaEuro areaEurope & Central AsiaEurope & Central Asia (excluding high income)Europe & Central Asia (IDA & IBRD countries)European UnionFaroe IslandsFijiFinlandFragile and conflict affected situationsFranceFrench PolynesiaGabonGambia, TheGeorgiaGermanyGhanaGibraltarGreeceGreenlandGrenadaGuamGuatemalaGuineaGuinea-BissauGuyanaHaitiHeavily indebted poor countries (HIPC)High incomeHondurasHong Kong SAR, ChinaHungaryIBRD onlyIcelandIDA & IBRD totalIDA blendIDA onlyIDA totalIndiaIndonesiaIran, Islamic Rep.IraqIrelandIsle of ManIsraelItalyJamaicaJapanJordanKazakhstanKenyaKiribatiKorea, Dem. People’s Rep.Korea, Rep.KosovoKuwaitKyrgyz RepublicLao PDRLate-demographic dividendLatin America & Caribbean Latin America & Caribbean (excluding high income)Latin America & the Caribbean (IDA & IBRD countries)LatviaLeast developed countries: UN classificationLebanonLesothoLiberiaLibyaLiechtensteinLithuaniaLow & middle incomeLow incomeLower middle incomeLuxembourgMacao SAR, ChinaMacedonia, FYRMadagascarMalawiMalaysiaMaldivesMaliMaltaMarshall IslandsMauritaniaMauritiusMexicoMicronesia, Fed. Sts.Middle East & North AfricaMiddle East & North Africa (excluding high income)Middle East & North Africa (IDA & IBRD countries)Middle incomeMoldovaMonacoMongoliaMontenegroMoroccoMozambiqueMyanmarNamibiaNauruNepalNetherlandsNew CaledoniaNew ZealandNicaraguaNigerNigeriaNorth AmericaNorthern Mariana IslandsNorwayOECD membersOmanOther small statesPacific island small statesPakistanPalauPanamaPapua New GuineaParaguayPeruPhilippinesPolandPortugalPost-demographic dividendPre-demographic dividendPuerto RicoQatarRomaniaRussian FederationRwandaSamoaSan MarinoSao Tome and PrincipeSaudi ArabiaSenegalSerbiaSeychellesSierra LeoneSingaporeSint Maarten (Dutch part)Slovak RepublicSloveniaSmall statesSolomon IslandsSomaliaSouth AfricaSouth AsiaSouth Asia (IDA & IBRD)SpainSri LankaSt. Kitts and NevisSt. LuciaSt. Martin (French part)St. Vincent and the GrenadinesSub-Saharan Africa Sub-Saharan Africa (excluding high income)Sub-Saharan Africa (IDA & IBRD countries)SudanSurinameSwazilandSwedenSwitzerlandSyrian Arab RepublicTajikistanTanzaniaThailandTimor-LesteTogoTongaTrinidad and TobagoTunisiaTurkeyTurkmenistanTurks and Caicos IslandsTuvaluUgandaUkraineUnited Arab EmiratesUnited KingdomUnited StatesUpper middle incomeUruguayUzbekistanVanuatuVenezuela, RBVietnamVirgin Islands (U.S.)West Bank and GazaWorldYemen, Rep.ZambiaZimbabwe Linea del tempo:
Questa scala temporale mostra un grafico dal 1962 anno al 2016 anno. World. I dati fino ad 1961 anno non disponibili. Il numero di osservazioni attuali secondo i date: 55.
La fonte (nome):
Indicatori dello sviluppo mondiale
La fonte (organizzazione):
Food and Agriculture Organization and World Bank population estimates.
Categorie:
Urban Development
sono stati aggiornati
23 apr 2017 anni
Indicatori delle variazioni dei valori per anni
Minima:
23.712
1 gen 1962 anni
Massimo:
56.629
1 gen 2016 anni
Alla data di osservazione
Valore
Variazione assoluta
La variazione rispetto al valore precedente
1 gen 1962 anni
23.712
+23.712
0.0%
1 gen 1963 anni
24.12
+0.408
1.72%
1 gen 1964 anni
24.62
+0.5
2.07%
1 gen 1965 anni
25.125
+0.504
2.05%
1 gen 1966 anni
25.639
+0.515
2.05%
1 gen 1967 anni
26.178
+0.539
2.1%
1 gen 1968 anni
26.714
+0.536
2.05%
1 gen 1969 anni
27.256
+0.542
2.03%
1 gen 1970 anni
27.83
+0.574
2.11%
1 gen 1971 anni
28.411
+0.581
2.09%
1 gen 1972 anni
29.008
+0.597
2.1%
1 gen 1973 anni
29.6
+0.592
2.04%
1 gen 1974 anni
30.186
+0.586
1.98%
1 gen 1975 anni
30.776
+0.59
1.96%
1 gen 1976 anni
31.354
+0.577
1.88%
1 gen 1977 anni
31.915
+0.562
1.79%
1 gen 1978 anni
32.475
+0.56
1.75%
1 gen 1979 anni
33.043
+0.569
1.75%
1 gen 1980 anni
33.626
+0.583
1.76%
1 gen 1981 anni
34.214
+0.588
1.75%
1 gen 1982 anni
34.815
+0.601
1.76%
1 gen 1983 anni
35.439
+0.624
1.79%
1 gen 1984 anni
36.069
+0.629
1.78%
1 gen 1985 anni
36.696
+0.628
1.74%
1 gen 1986 anni
37.336
+0.64
1.74%
1 gen 1987 anni
37.997
+0.661
1.77%
1 gen 1988 anni
38.675
+0.678
1.78%
1 gen 1989 anni
39.36
+0.685
1.77%
1 gen 1990 anni
40.047
+0.686
1.74%
1 gen 1991 anni
40.741
+0.694
1.73%
1 gen 1992 anni
41.411
+0.67
1.65%
1 gen 1993 anni
42.057
+0.646
1.56%
1 gen 1994 anni
42.711
+0.654
1.56%
1 gen 1995 anni
43.359
+0.648
1.52%
1 gen 1996 anni
44.014
+0.655
1.51%
1 gen 1997 anni
44.652
+0.638
1.45%
1 gen 1998 anni
45.266
+0.614
1.38%
1 gen 1999 anni
45.906
+0.64
1.41%
1 gen 2000 anni
46.527
+0.62
1.35%
1 gen 2001 anni
47.138
+0.611
1.31%
1 gen 2002 anni
47.75
+0.613
1.3%
1 gen 2003 anni
48.36
+0.61
1.28%
1 gen 2004 anni
48.97
+0.61
1.26%
1 gen 2005 anni
49.585
+0.615
1.26%
1 gen 2006 anni
50.203
+0.618
1.25%
1 gen 2007 anni
50.827
+0.624
1.24%
1 gen 2008 anni
51.453
+0.626
1.23%
1 gen 2009 anni
52.095
+0.642
1.25%
1 gen 2010 anni
52.732
+0.638
1.22%
1 gen 2011 anni
53.369
+0.637
1.21%
1 gen 2012 anni
53.998
+0.629
1.18%
1 gen 2013 anni
54.647
+0.649
1.2%
1 gen 2014 anni
55.304
+0.657
1.2%
1 gen 2015 anni
55.966
+0.662
1.2%
1 gen 2016 anni
56.629
+0.663
1.18%
Classificazione dei paesi secondo i statistiche attuali per anni


Commenti: