29
/it/
it
AIzaSyAYiBZKx7MnpbEhh9jyipgxe19OcubqV5w
April 1, 2024
208912
New Caledonia
NCL
true
2
1
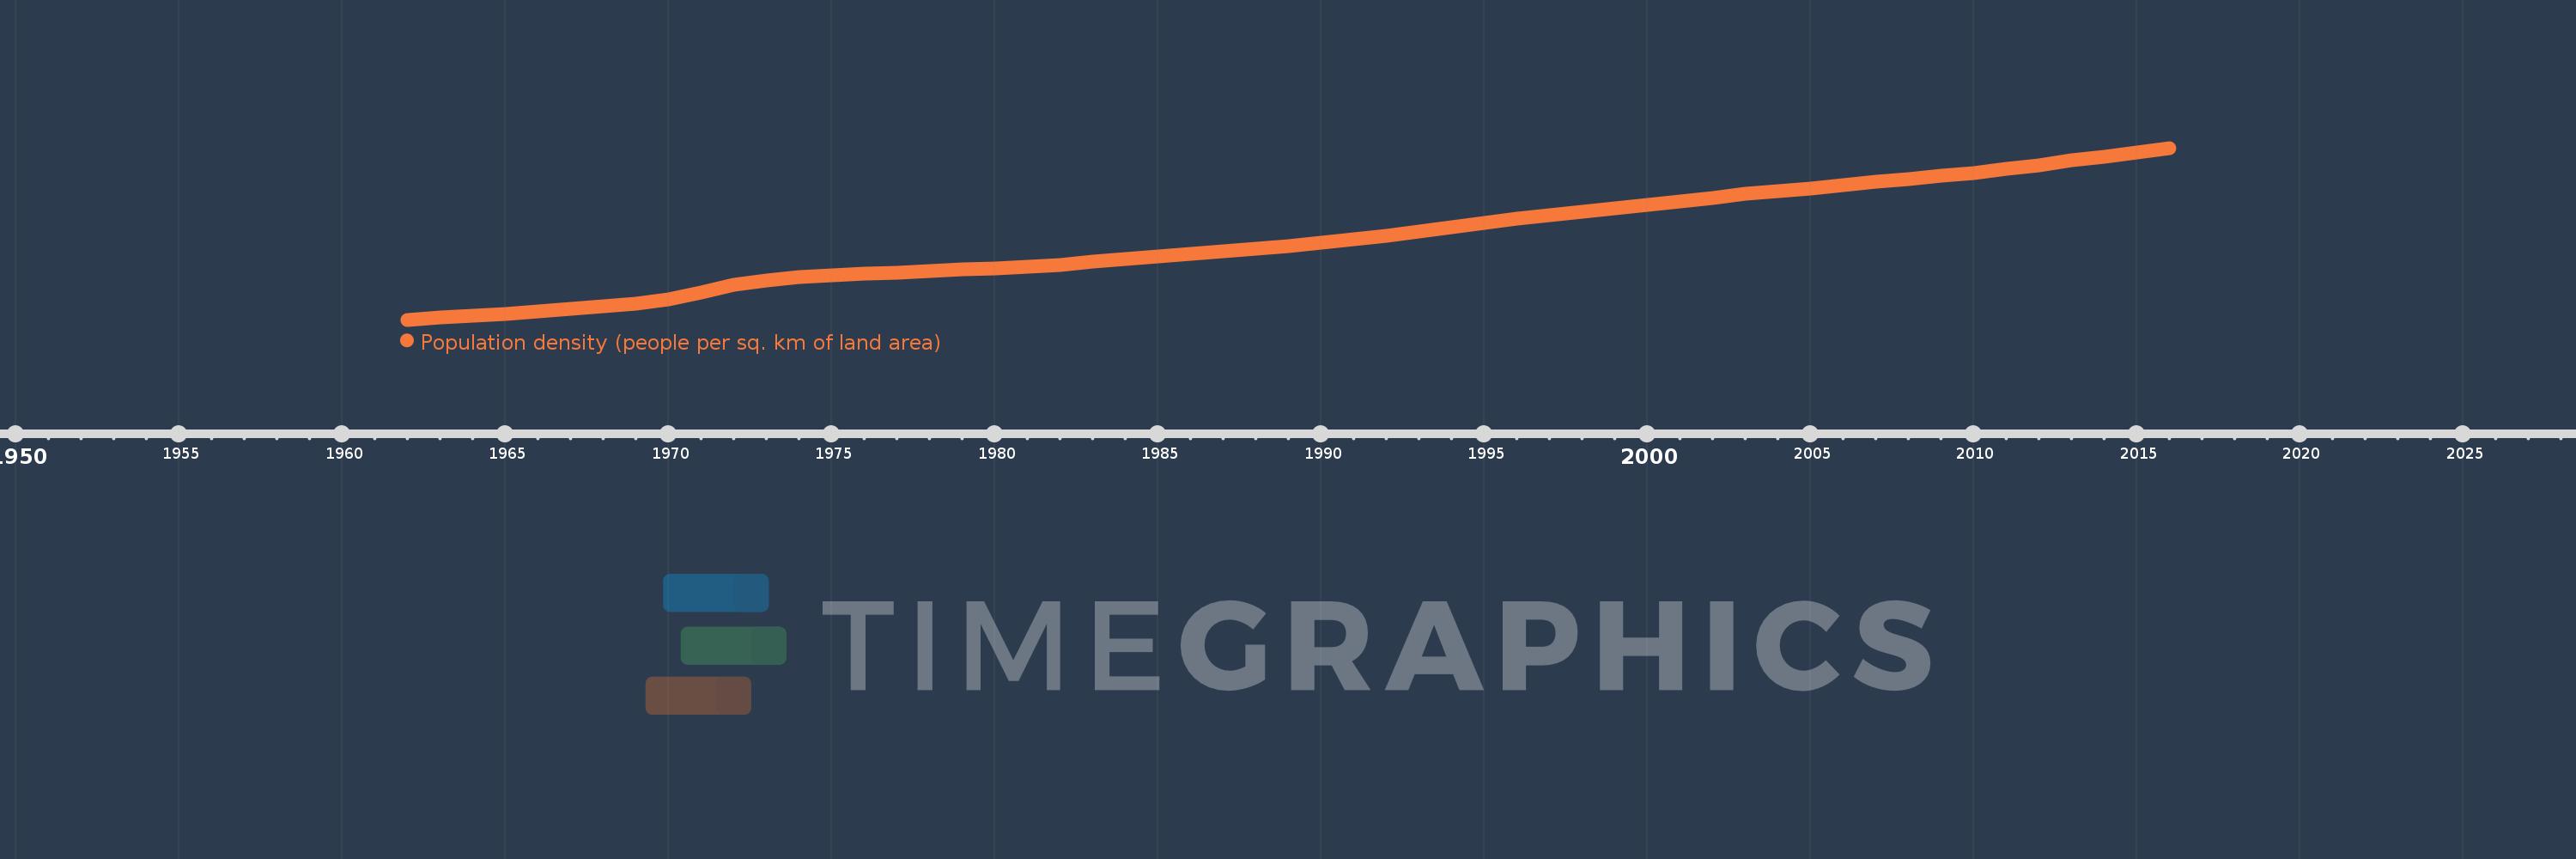
Population density (people per sq. km of land area)
2016,2015,2014,2013,2012,2011,2010,2009,2008,2007,2006,2005,2004,2003,2002,2001,2000,1999,1998,1997,1996,1995,1994,1993,1992,1991,1990,1989,1988,1987,1986,1985,1984,1983,1982,1981,1980,1979,1978,1977,1976,1975,1974,1973,1972,1971,1970,1969,1968,1967,1966,1965,1964,1963,1962
Queste statistiche in altri paesi:
AfghanistanAlbaniaAlgeriaAmerican SamoaAndorraAngolaAntigua and BarbudaArab WorldArgentinaArmeniaArubaAustraliaAustriaAzerbaijanBahamas, TheBahrainBangladeshBarbadosBelarusBelgiumBelizeBeninBermudaBhutanBoliviaBosnia and HerzegovinaBotswanaBrazilBritish Virgin IslandsBrunei DarussalamBulgariaBurkina FasoBurundiCabo VerdeCambodiaCameroonCanadaCaribbean small statesCayman IslandsCentral African RepublicCentral Europe and the BalticsChadChannel IslandsChileChinaColombiaComorosCongo, Dem. Rep.Congo, Rep.Costa RicaCote d'IvoireCroatiaCubaCuracaoCyprusCzech RepublicDenmarkDjiboutiDominicaDominican RepublicEarly-demographic dividendEast Asia & PacificEast Asia & Pacific (excluding high income)East Asia & Pacific (IDA & IBRD countries)EcuadorEgypt, Arab Rep.El SalvadorEquatorial GuineaEritreaEstoniaEthiopiaEuro areaEurope & Central AsiaEurope & Central Asia (excluding high income)Europe & Central Asia (IDA & IBRD countries)European UnionFaroe IslandsFijiFinlandFragile and conflict affected situationsFranceFrench PolynesiaGabonGambia, TheGeorgiaGermanyGhanaGibraltarGreeceGreenlandGrenadaGuamGuatemalaGuineaGuinea-BissauGuyanaHaitiHeavily indebted poor countries (HIPC)High incomeHondurasHong Kong SAR, ChinaHungaryIBRD onlyIcelandIDA & IBRD totalIDA blendIDA onlyIDA totalIndiaIndonesiaIran, Islamic Rep.IraqIrelandIsle of ManIsraelItalyJamaicaJapanJordanKazakhstanKenyaKiribatiKorea, Dem. People’s Rep.Korea, Rep.KosovoKuwaitKyrgyz RepublicLao PDRLate-demographic dividendLatin America & Caribbean Latin America & Caribbean (excluding high income)Latin America & the Caribbean (IDA & IBRD countries)LatviaLeast developed countries: UN classificationLebanonLesothoLiberiaLibyaLiechtensteinLithuaniaLow & middle incomeLow incomeLower middle incomeLuxembourgMacao SAR, ChinaMacedonia, FYRMadagascarMalawiMalaysiaMaldivesMaliMaltaMarshall IslandsMauritaniaMauritiusMexicoMicronesia, Fed. Sts.Middle East & North AfricaMiddle East & North Africa (excluding high income)Middle East & North Africa (IDA & IBRD countries)Middle incomeMoldovaMonacoMongoliaMontenegroMoroccoMozambiqueMyanmarNamibiaNauruNepalNetherlandsNew CaledoniaNew ZealandNicaraguaNigerNigeriaNorth AmericaNorthern Mariana IslandsNorwayOECD membersOmanOther small statesPacific island small statesPakistanPalauPanamaPapua New GuineaParaguayPeruPhilippinesPolandPortugalPost-demographic dividendPre-demographic dividendPuerto RicoQatarRomaniaRussian FederationRwandaSamoaSan MarinoSao Tome and PrincipeSaudi ArabiaSenegalSerbiaSeychellesSierra LeoneSingaporeSint Maarten (Dutch part)Slovak RepublicSloveniaSmall statesSolomon IslandsSomaliaSouth AfricaSouth AsiaSouth Asia (IDA & IBRD)SpainSri LankaSt. Kitts and NevisSt. LuciaSt. Martin (French part)St. Vincent and the GrenadinesSub-Saharan Africa Sub-Saharan Africa (excluding high income)Sub-Saharan Africa (IDA & IBRD countries)SudanSurinameSwazilandSwedenSwitzerlandSyrian Arab RepublicTajikistanTanzaniaThailandTimor-LesteTogoTongaTrinidad and TobagoTunisiaTurkeyTurkmenistanTurks and Caicos IslandsTuvaluUgandaUkraineUnited Arab EmiratesUnited KingdomUnited StatesUpper middle incomeUruguayUzbekistanVanuatuVenezuela, RBVietnamVirgin Islands (U.S.)West Bank and GazaWorldYemen, Rep.ZambiaZimbabwe Linea del tempo:
Questa scala temporale mostra un grafico dal 1962 anno al 2016 anno. New Caledonia. I dati fino ad 1961 anno non disponibili. Il numero di osservazioni attuali secondo i date: 55.
La fonte (nome):
Indicatori dello sviluppo mondiale
La fonte (organizzazione):
Food and Agriculture Organization and World Bank population estimates.
Categorie:
Urban Development
sono stati aggiornati
23 apr 2017 anni
Indicatori delle variazioni dei valori per anni
Minima:
4.442
1 gen 1962 anni
Massimo:
14.934
1 gen 2016 anni
Alla data di osservazione
Valore
Variazione assoluta
La variazione rispetto al valore precedente
1 gen 1962 anni
4.442
+4.442
0.0%
1 gen 1963 anni
4.562
+0.12
2.71%
1 gen 1964 anni
4.688
+0.126
2.76%
1 gen 1965 anni
4.819
+0.131
2.8%
1 gen 1966 anni
4.951
+0.131
2.72%
1 gen 1967 anni
5.115
+0.164
3.31%
1 gen 1968 anni
5.279
+0.164
3.21%
1 gen 1969 anni
5.443
+0.164
3.11%
1 gen 1970 anni
5.689
+0.246
4.52%
1 gen 1971 anni
6.127
+0.438
7.69%
1 gen 1972 anni
6.565
+0.438
7.14%
1 gen 1973 anni
6.865
+0.301
4.58%
1 gen 1974 anni
7.03
+0.164
2.39%
1 gen 1975 anni
7.166
+0.137
1.95%
1 gen 1976 anni
7.248
+0.082
1.15%
1 gen 1977 anni
7.33
+0.082
1.13%
1 gen 1978 anni
7.44
+0.109
1.49%
1 gen 1979 anni
7.522
+0.082
1.1%
1 gen 1980 anni
7.577
+0.055
0.73%
1 gen 1981 anni
7.661
+0.085
1.12%
1 gen 1982 anni
7.804
+0.142
1.86%
1 gen 1983 anni
7.97
+0.167
2.14%
1 gen 1984 anni
8.135
+0.164
2.06%
1 gen 1985 anni
8.296
+0.161
1.98%
1 gen 1986 anni
8.449
+0.153
1.85%
1 gen 1987 anni
8.608
+0.159
1.88%
1 gen 1988 anni
8.78
+0.172
2.0%
1 gen 1989 anni
8.952
+0.172
1.96%
1 gen 1990 anni
9.13
+0.178
1.98%
1 gen 1991 anni
9.349
+0.219
2.4%
1 gen 1992 anni
9.593
+0.244
2.61%
1 gen 1993 anni
9.836
+0.243
2.53%
1 gen 1994 anni
10.093
+0.257
2.61%
1 gen 1995 anni
10.366
+0.273
2.7%
1 gen 1996 anni
10.603
+0.237
2.29%
1 gen 1997 anni
10.808
+0.205
1.93%
1 gen 1998 anni
11.018
+0.211
1.95%
1 gen 1999 anni
11.23
+0.211
1.92%
1 gen 2000 anni
11.445
+0.215
1.92%
1 gen 2001 anni
11.665
+0.22
1.92%
1 gen 2002 anni
11.889
+0.224
1.92%
1 gen 2003 anni
12.117
+0.228
1.92%
1 gen 2004 anni
12.309
+0.192
1.58%
1 gen 2005 anni
12.473
+0.164
1.33%
1 gen 2006 anni
12.637
+0.164
1.32%
1 gen 2007 anni
12.856
+0.219
1.73%
1 gen 2008 anni
13.02
+0.164
1.28%
1 gen 2009 anni
13.239
+0.219
1.68%
1 gen 2010 anni
13.403
+0.164
1.24%
1 gen 2011 anni
13.676
+0.274
2.04%
1 gen 2012 anni
13.895
+0.219
1.6%
1 gen 2013 anni
14.168
+0.274
1.97%
1 gen 2014 anni
14.387
+0.219
1.54%
1 gen 2015 anni
14.661
+0.274
1.9%
1 gen 2016 anni
14.934
+0.274
1.87%
Classificazione dei paesi secondo i statistiche attuali per anni


Commenti: