29
/it/
it
AIzaSyAYiBZKx7MnpbEhh9jyipgxe19OcubqV5w
April 1, 2024
86982
Bolivia
BOL
true
2
1
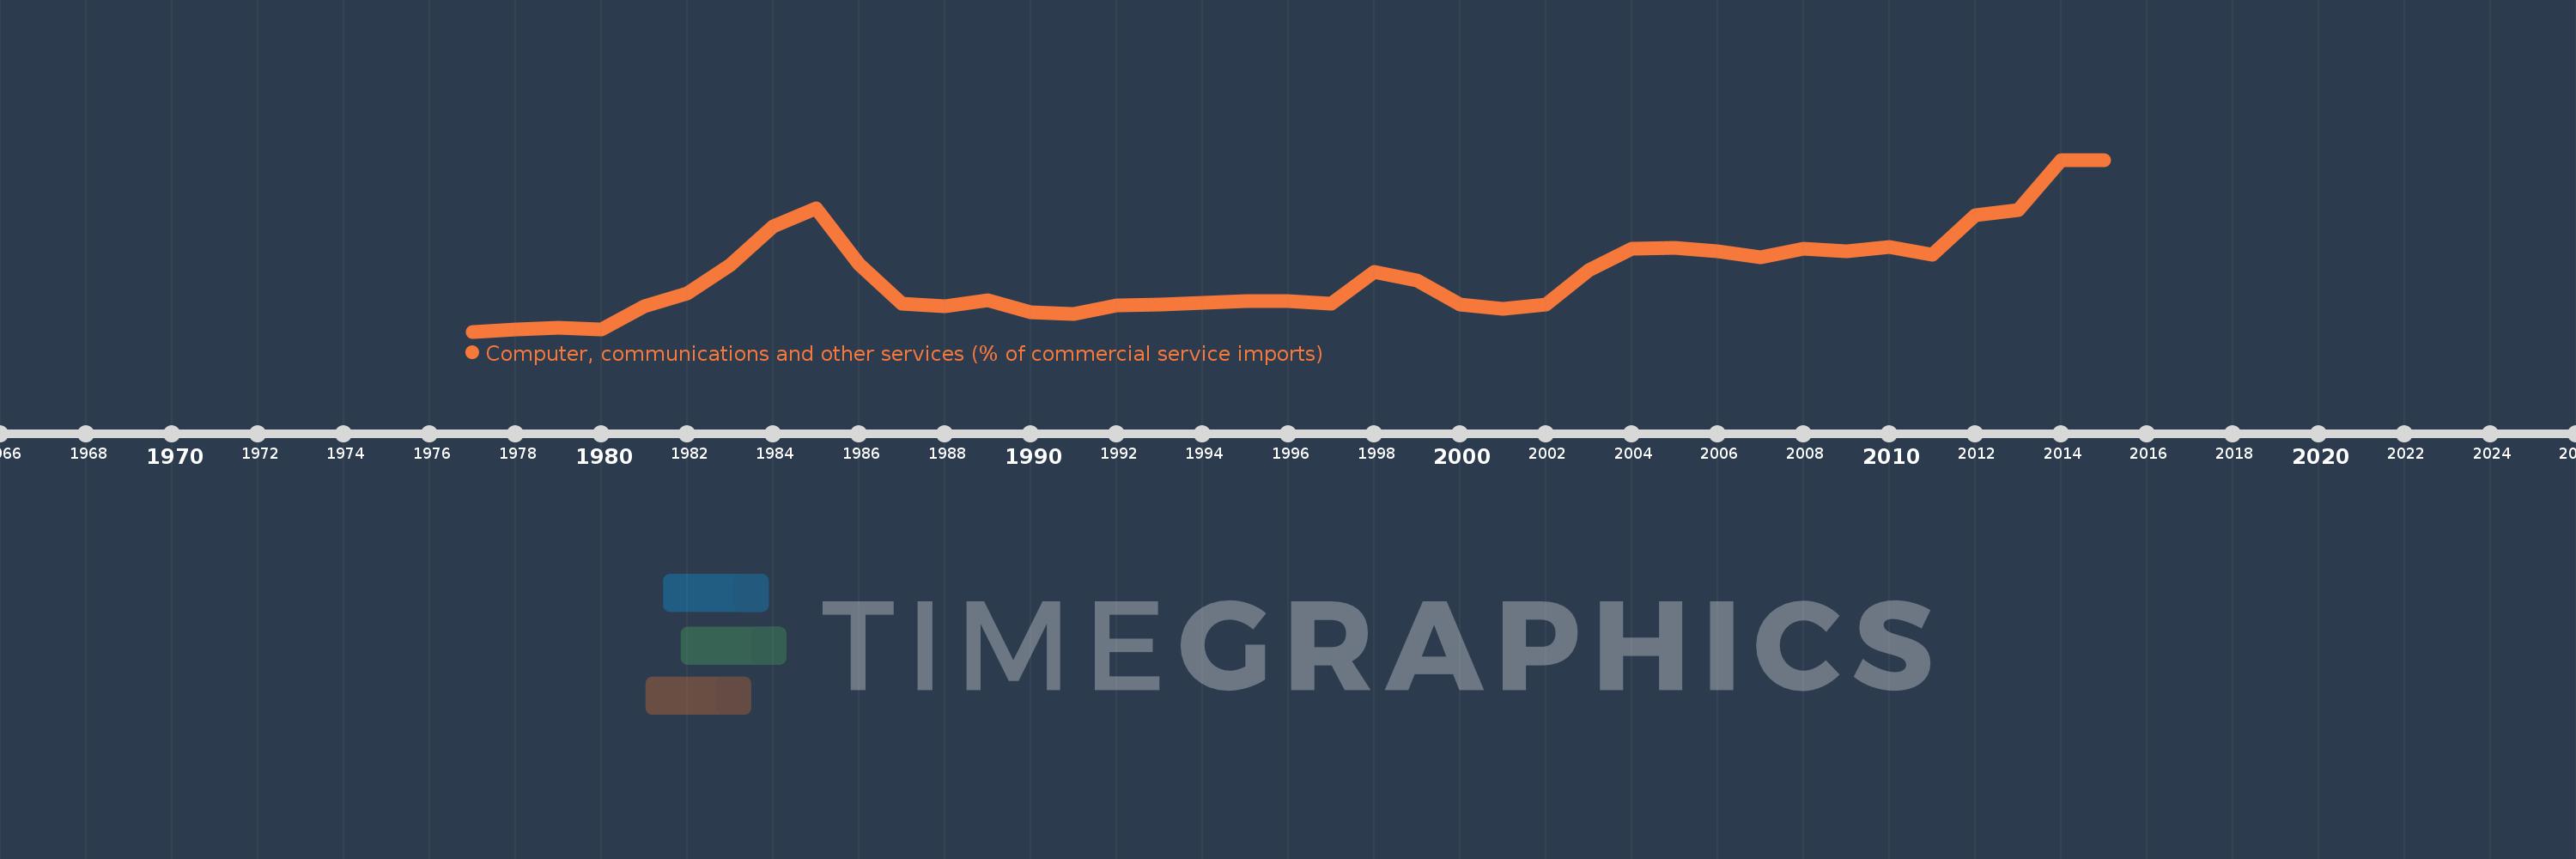
Computer, communications and other services (% of commercial service imports)
2015,2014,2013,2012,2011,2010,2009,2008,2007,2006,2005,2004,2003,2002,2001,2000,1999,1998,1997,1996,1995,1994,1993,1992,1991,1990,1989,1988,1987,1986,1985,1984,1983,1982,1981,1980,1979,1978,1977
Queste statistiche in altri paesi:
AfghanistanAlbaniaAlgeriaAngolaAntigua and BarbudaArab WorldArgentinaArmeniaArubaAustraliaAustriaAzerbaijanBahamas, TheBahrainBangladeshBarbadosBelarusBelgiumBelizeBeninBermudaBhutanBoliviaBosnia and HerzegovinaBotswanaBrazilBrunei DarussalamBulgariaBurkina FasoBurundiCabo VerdeCambodiaCameroonCanadaCaribbean small statesCentral African RepublicCentral Europe and the BalticsChadChileChinaColombiaComorosCongo, Dem. Rep.Congo, Rep.Costa RicaCote d'IvoireCroatiaCuracaoCyprusCzech RepublicDenmarkDjiboutiDominicaDominican RepublicEarly-demographic dividendEast Asia & PacificEast Asia & Pacific (excluding high income)East Asia & Pacific (IDA & IBRD countries)EcuadorEgypt, Arab Rep.El SalvadorEquatorial GuineaEritreaEstoniaEthiopiaEuro areaEurope & Central AsiaEurope & Central Asia (excluding high income)Europe & Central Asia (IDA & IBRD countries)European UnionFaroe IslandsFijiFinlandFragile and conflict affected situationsFranceFrench PolynesiaGabonGambia, TheGeorgiaGermanyGhanaGreeceGrenadaGuatemalaGuineaGuinea-BissauGuyanaHaitiHeavily indebted poor countries (HIPC)High incomeHondurasHong Kong SAR, ChinaHungaryIBRD onlyIcelandIDA & IBRD totalIDA onlyIDA totalIndiaIndonesiaIran, Islamic Rep.IraqIrelandIsraelItalyJamaicaJapanJordanKazakhstanKenyaKiribatiKorea, Rep.KosovoKuwaitKyrgyz RepublicLao PDRLate-demographic dividendLatin America & Caribbean Latin America & Caribbean (excluding high income)Latin America & the Caribbean (IDA & IBRD countries)LatviaLeast developed countries: UN classificationLebanonLesothoLiberiaLibyaLithuaniaLow & middle incomeLow incomeLower middle incomeLuxembourgMacao SAR, ChinaMacedonia, FYRMadagascarMalawiMalaysiaMaldivesMaliMaltaMarshall IslandsMauritaniaMauritiusMexicoMicronesia, Fed. Sts.Middle East & North AfricaMiddle East & North Africa (excluding high income)Middle East & North Africa (IDA & IBRD countries)Middle incomeMoldovaMongoliaMontenegroMoroccoMozambiqueMyanmarNamibiaNepalNetherlandsNew CaledoniaNew ZealandNicaraguaNigerNigeriaNorth AmericaNorwayOECD membersOmanOther small statesPacific island small statesPakistanPalauPanamaPapua New GuineaParaguayPeruPhilippinesPolandPortugalPost-demographic dividendPre-demographic dividendQatarRomaniaRussian FederationRwandaSamoaSao Tome and PrincipeSaudi ArabiaSenegalSerbiaSeychellesSierra LeoneSingaporeSint Maarten (Dutch part)Slovak RepublicSloveniaSmall statesSolomon IslandsSouth AfricaSouth AsiaSouth Asia (IDA & IBRD)South SudanSpainSri LankaSt. Kitts and NevisSt. LuciaSt. Vincent and the GrenadinesSub-Saharan Africa Sub-Saharan Africa (excluding high income)Sub-Saharan Africa (IDA & IBRD countries)SudanSurinameSwazilandSwedenSwitzerlandSyrian Arab RepublicTajikistanTanzaniaThailandTimor-LesteTogoTongaTrinidad and TobagoTunisiaTurkeyTuvaluUgandaUkraineUnited KingdomUnited StatesUpper middle incomeUruguayVanuatuVenezuela, RBWest Bank and GazaWorldYemen, Rep.ZambiaZimbabwe Linea del tempo:
Questa scala temporale mostra un grafico dal 1977 anno al 2015 anno. Bolivia. I dati fino ad 1976 anno non disponibili. Il numero di osservazioni attuali secondo i date: 39.
La fonte (nome):
Indicatori dello sviluppo mondiale
La fonte (organizzazione):
International Monetary Fund, Balance of Payments Statistics Yearbook and data files.
Categorie:
Private Sector, Trade
sono stati aggiornati
23 apr 2017 anni
Indicatori delle variazioni dei valori per anni
Minima:
4.709
1 gen 1977 anni
Massimo:
33.364
1 gen 2014 anni
Alla data di osservazione
Valore
Variazione assoluta
La variazione rispetto al valore precedente
1 gen 1977 anni
4.709
+4.709
0.0%
1 gen 1978 anni
5.034
+0.325
6.91%
1 gen 1979 anni
5.312
+0.278
5.53%
1 gen 1980 anni
5.064
-0.248
-4.66%
1 gen 1981 anni
8.919
+3.854
76.11%
1 gen 1982 anni
11.026
+2.107
23.62%
1 gen 1983 anni
15.826
+4.8
43.54%
1 gen 1984 anni
22.227
+6.401
40.45%
1 gen 1985 anni
25.27
+3.042
13.69%
1 gen 1986 anni
15.991
-9.278
-36.72%
1 gen 1987 anni
9.332
-6.66
-41.65%
1 gen 1988 anni
8.985
-0.346
-3.71%
1 gen 1989 anni
9.906
+0.921
10.25%
1 gen 1990 anni
7.907
-1.999
-20.18%
1 gen 1991 anni
7.639
-0.268
-3.38%
1 gen 1992 anni
9.122
+1.483
19.41%
1 gen 1993 anni
9.176
+0.053
0.59%
1 gen 1994 anni
9.511
+0.335
3.66%
1 gen 1995 anni
9.831
+0.32
3.37%
1 gen 1996 anni
9.853
+0.022
0.22%
1 gen 1997 anni
9.301
-0.553
-5.61%
1 gen 1998 anni
14.726
+5.426
58.34%
1 gen 1999 anni
13.207
-1.519
-10.32%
1 gen 2000 anni
9.277
-3.93
-29.76%
1 gen 2001 anni
8.533
-0.744
-8.02%
1 gen 2002 anni
9.199
+0.666
7.8%
1 gen 2003 anni
14.983
+5.785
62.89%
1 gen 2004 anni
18.52
+3.536
23.6%
1 gen 2005 anni
18.698
+0.178
0.96%
1 gen 2006 anni
18.125
-0.573
-3.07%
1 gen 2007 anni
17.063
-1.062
-5.86%
1 gen 2008 anni
18.471
+1.409
8.26%
1 gen 2009 anni
18.155
-0.316
-1.71%
1 gen 2010 anni
18.849
+0.694
3.83%
1 gen 2011 anni
17.52
-1.33
-7.05%
1 gen 2012 anni
24.103
+6.584
37.58%
1 gen 2013 anni
25.052
+0.949
3.94%
1 gen 2014 anni
33.364
+8.312
33.18%
1 gen 2015 anni
33.232
-0.133
-0.4%
Classificazione dei paesi secondo i statistiche attuali per anni


Commenti: