29
/it/
it
AIzaSyAYiBZKx7MnpbEhh9jyipgxe19OcubqV5w
April 1, 2024
212752
Nigeria
NGA
true
2
1
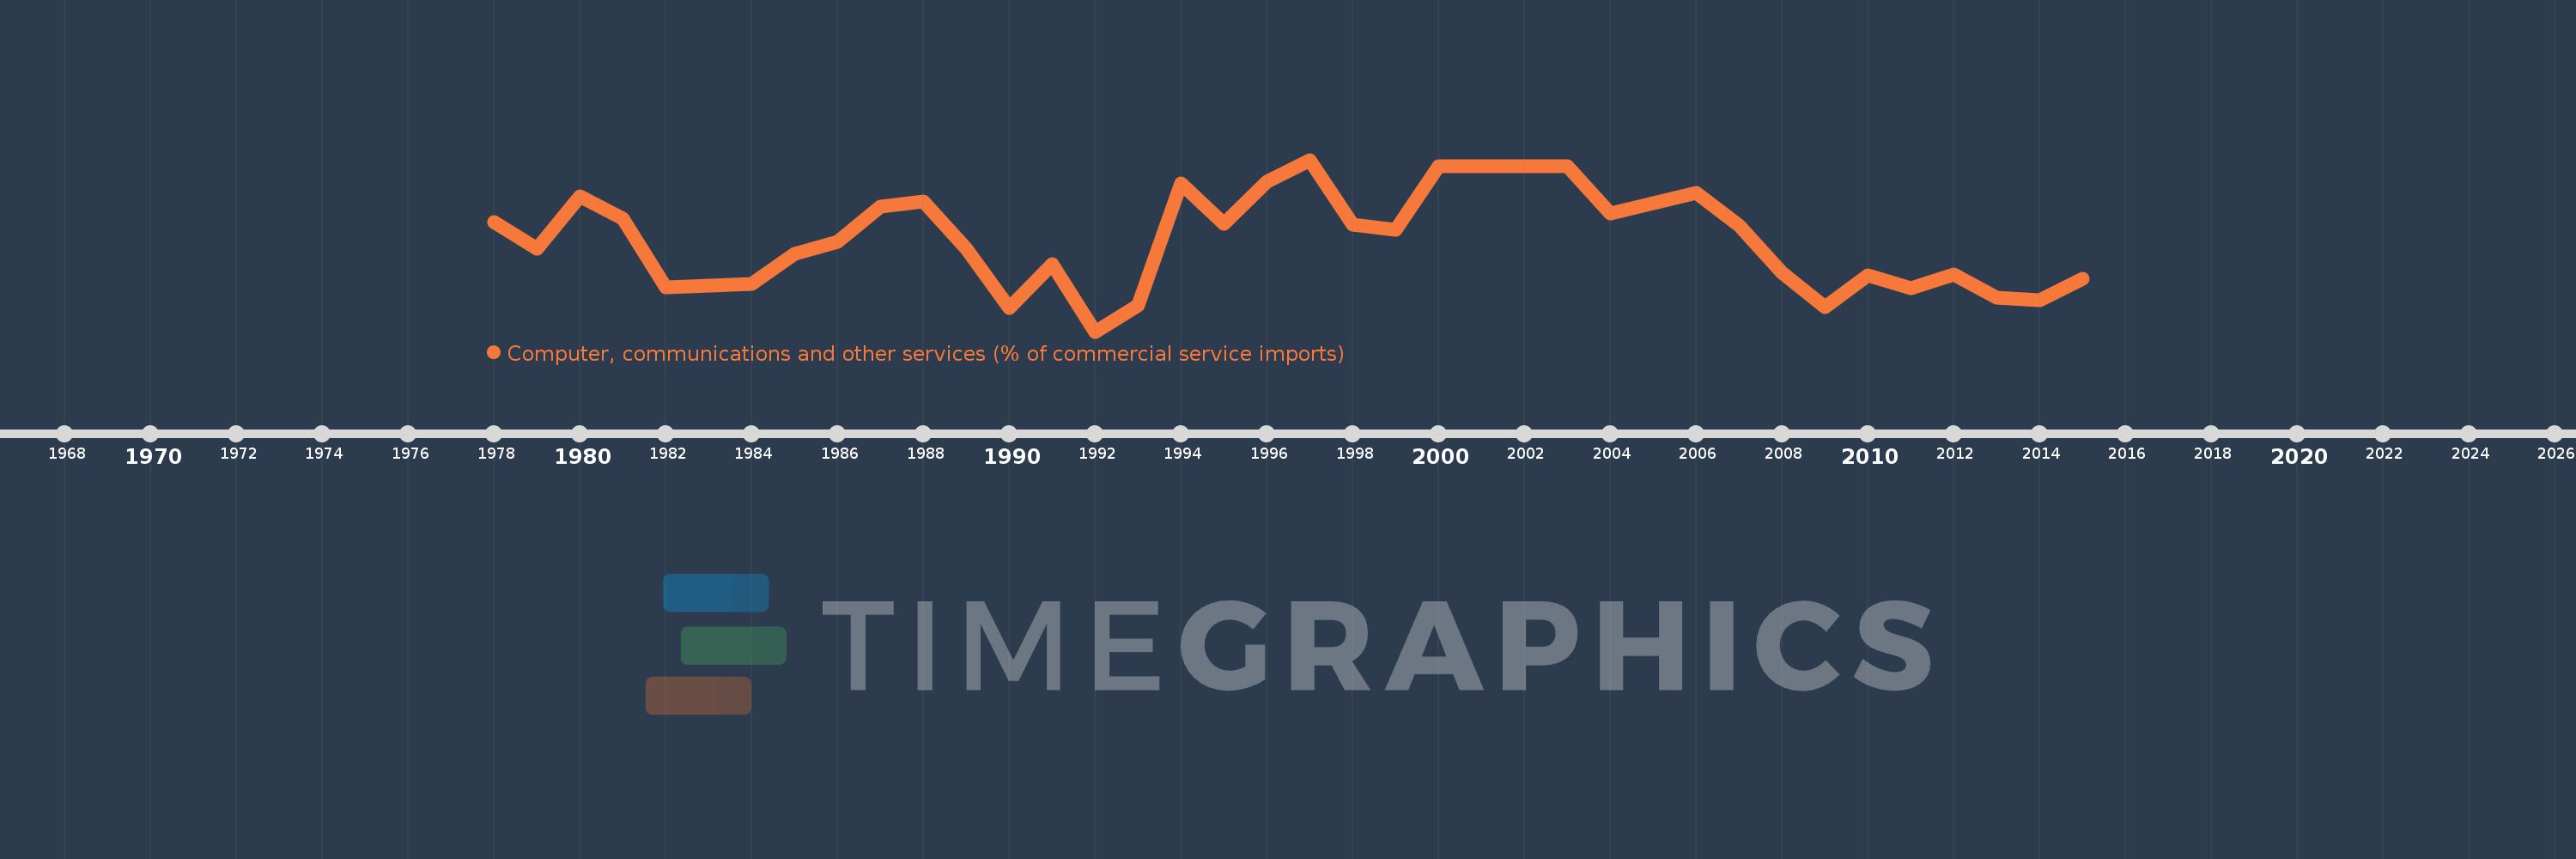
Computer, communications and other services (% of commercial service imports)
2015,2014,2013,2012,2011,2010,2009,2008,2007,2006,2004,2003,2002,2001,2000,1999,1998,1997,1996,1995,1994,1993,1992,1991,1990,1989,1988,1987,1986,1985,1984,1983,1982,1981,1980,1979,1978
Queste statistiche in altri paesi:
AfghanistanAlbaniaAlgeriaAngolaAntigua and BarbudaArab WorldArgentinaArmeniaArubaAustraliaAustriaAzerbaijanBahamas, TheBahrainBangladeshBarbadosBelarusBelgiumBelizeBeninBermudaBhutanBoliviaBosnia and HerzegovinaBotswanaBrazilBrunei DarussalamBulgariaBurkina FasoBurundiCabo VerdeCambodiaCameroonCanadaCaribbean small statesCentral African RepublicCentral Europe and the BalticsChadChileChinaColombiaComorosCongo, Dem. Rep.Congo, Rep.Costa RicaCote d'IvoireCroatiaCuracaoCyprusCzech RepublicDenmarkDjiboutiDominicaDominican RepublicEarly-demographic dividendEast Asia & PacificEast Asia & Pacific (excluding high income)East Asia & Pacific (IDA & IBRD countries)EcuadorEgypt, Arab Rep.El SalvadorEquatorial GuineaEritreaEstoniaEthiopiaEuro areaEurope & Central AsiaEurope & Central Asia (excluding high income)Europe & Central Asia (IDA & IBRD countries)European UnionFaroe IslandsFijiFinlandFragile and conflict affected situationsFranceFrench PolynesiaGabonGambia, TheGeorgiaGermanyGhanaGreeceGrenadaGuatemalaGuineaGuinea-BissauGuyanaHaitiHeavily indebted poor countries (HIPC)High incomeHondurasHong Kong SAR, ChinaHungaryIBRD onlyIcelandIDA & IBRD totalIDA onlyIDA totalIndiaIndonesiaIran, Islamic Rep.IraqIrelandIsraelItalyJamaicaJapanJordanKazakhstanKenyaKiribatiKorea, Rep.KosovoKuwaitKyrgyz RepublicLao PDRLate-demographic dividendLatin America & Caribbean Latin America & Caribbean (excluding high income)Latin America & the Caribbean (IDA & IBRD countries)LatviaLeast developed countries: UN classificationLebanonLesothoLiberiaLibyaLithuaniaLow & middle incomeLow incomeLower middle incomeLuxembourgMacao SAR, ChinaMacedonia, FYRMadagascarMalawiMalaysiaMaldivesMaliMaltaMarshall IslandsMauritaniaMauritiusMexicoMicronesia, Fed. Sts.Middle East & North AfricaMiddle East & North Africa (excluding high income)Middle East & North Africa (IDA & IBRD countries)Middle incomeMoldovaMongoliaMontenegroMoroccoMozambiqueMyanmarNamibiaNepalNetherlandsNew CaledoniaNew ZealandNicaraguaNigerNigeriaNorth AmericaNorwayOECD membersOmanOther small statesPacific island small statesPakistanPalauPanamaPapua New GuineaParaguayPeruPhilippinesPolandPortugalPost-demographic dividendPre-demographic dividendQatarRomaniaRussian FederationRwandaSamoaSao Tome and PrincipeSaudi ArabiaSenegalSerbiaSeychellesSierra LeoneSingaporeSint Maarten (Dutch part)Slovak RepublicSloveniaSmall statesSolomon IslandsSouth AfricaSouth AsiaSouth Asia (IDA & IBRD)South SudanSpainSri LankaSt. Kitts and NevisSt. LuciaSt. Vincent and the GrenadinesSub-Saharan Africa Sub-Saharan Africa (excluding high income)Sub-Saharan Africa (IDA & IBRD countries)SudanSurinameSwazilandSwedenSwitzerlandSyrian Arab RepublicTajikistanTanzaniaThailandTimor-LesteTogoTongaTrinidad and TobagoTunisiaTurkeyTuvaluUgandaUkraineUnited KingdomUnited StatesUpper middle incomeUruguayVanuatuVenezuela, RBWest Bank and GazaWorldYemen, Rep.ZambiaZimbabwe Linea del tempo:
Questa scala temporale mostra un grafico dal 1978 anno al 2015 anno. Nigeria. I dati fino ad 1977 anno non disponibili. Il numero di osservazioni attuali secondo i date: 37.
La fonte (nome):
Indicatori dello sviluppo mondiale
La fonte (organizzazione):
International Monetary Fund, Balance of Payments Statistics Yearbook and data files.
Categorie:
Private Sector, Trade
sono stati aggiornati
23 apr 2017 anni
Indicatori delle variazioni dei valori per anni
Minima:
15.103
1 gen 1992 anni
Massimo:
60.252
1 gen 1997 anni
Alla data di osservazione
Valore
Variazione assoluta
La variazione rispetto al valore precedente
1 gen 1978 anni
43.826
+43.826
0.0%
1 gen 1979 anni
36.87
-6.956
-15.87%
1 gen 1980 anni
50.675
+13.805
37.44%
1 gen 1981 anni
44.844
-5.831
-11.51%
1 gen 1982 anni
26.823
-18.021
-40.19%
1 gen 1983 anni
27.26
+0.437
1.63%
1 gen 1984 anni
27.591
+0.33
1.21%
1 gen 1985 anni
35.622
+8.032
29.11%
1 gen 1986 anni
38.622
+3.0
8.42%
1 gen 1987 anni
47.889
+9.267
23.99%
1 gen 1988 anni
49.243
+1.354
2.83%
1 gen 1989 anni
36.979
-12.264
-24.9%
1 gen 1990 anni
21.285
-15.694
-42.44%
1 gen 1991 anni
32.933
+11.648
54.72%
1 gen 1992 anni
15.103
-17.83
-54.14%
1 gen 1993 anni
22.058
+6.955
46.05%
1 gen 1994 anni
54.077
+32.019
145.16%
1 gen 1995 anni
43.339
-10.738
-19.86%
1 gen 1996 anni
54.401
+11.062
25.52%
1 gen 1997 anni
60.252
+5.851
10.76%
1 gen 1998 anni
43.122
-17.13
-28.43%
1 gen 1999 anni
41.865
-1.258
-2.92%
1 gen 2000 anni
58.603
+16.739
39.98%
1 gen 2001 anni
58.555
-0.048
-0.08%
1 gen 2002 anni
58.555
+0.0
0.0%
1 gen 2003 anni
58.556
+0.0
0.0%
1 gen 2004 anni
46.136
-12.42
-21.21%
1 gen 2006 anni
51.672
+5.537
12.0%
1 gen 2007 anni
43.051
-8.622
-16.69%
1 gen 2008 anni
30.504
-12.547
-29.14%
1 gen 2009 anni
21.454
-9.05
-29.67%
1 gen 2010 anni
29.849
+8.395
39.13%
1 gen 2011 anni
26.48
-3.369
-11.29%
1 gen 2012 anni
30.167
+3.688
13.93%
1 gen 2013 anni
23.984
-6.183
-20.5%
1 gen 2014 anni
23.453
-0.531
-2.21%
1 gen 2015 anni
28.944
+5.491
23.41%
Classificazione dei paesi secondo i statistiche attuali per anni


Commenti: