29
/it/
it
AIzaSyAYiBZKx7MnpbEhh9jyipgxe19OcubqV5w
April 1, 2024
234479
Saudi Arabia
SAU
true
2
1
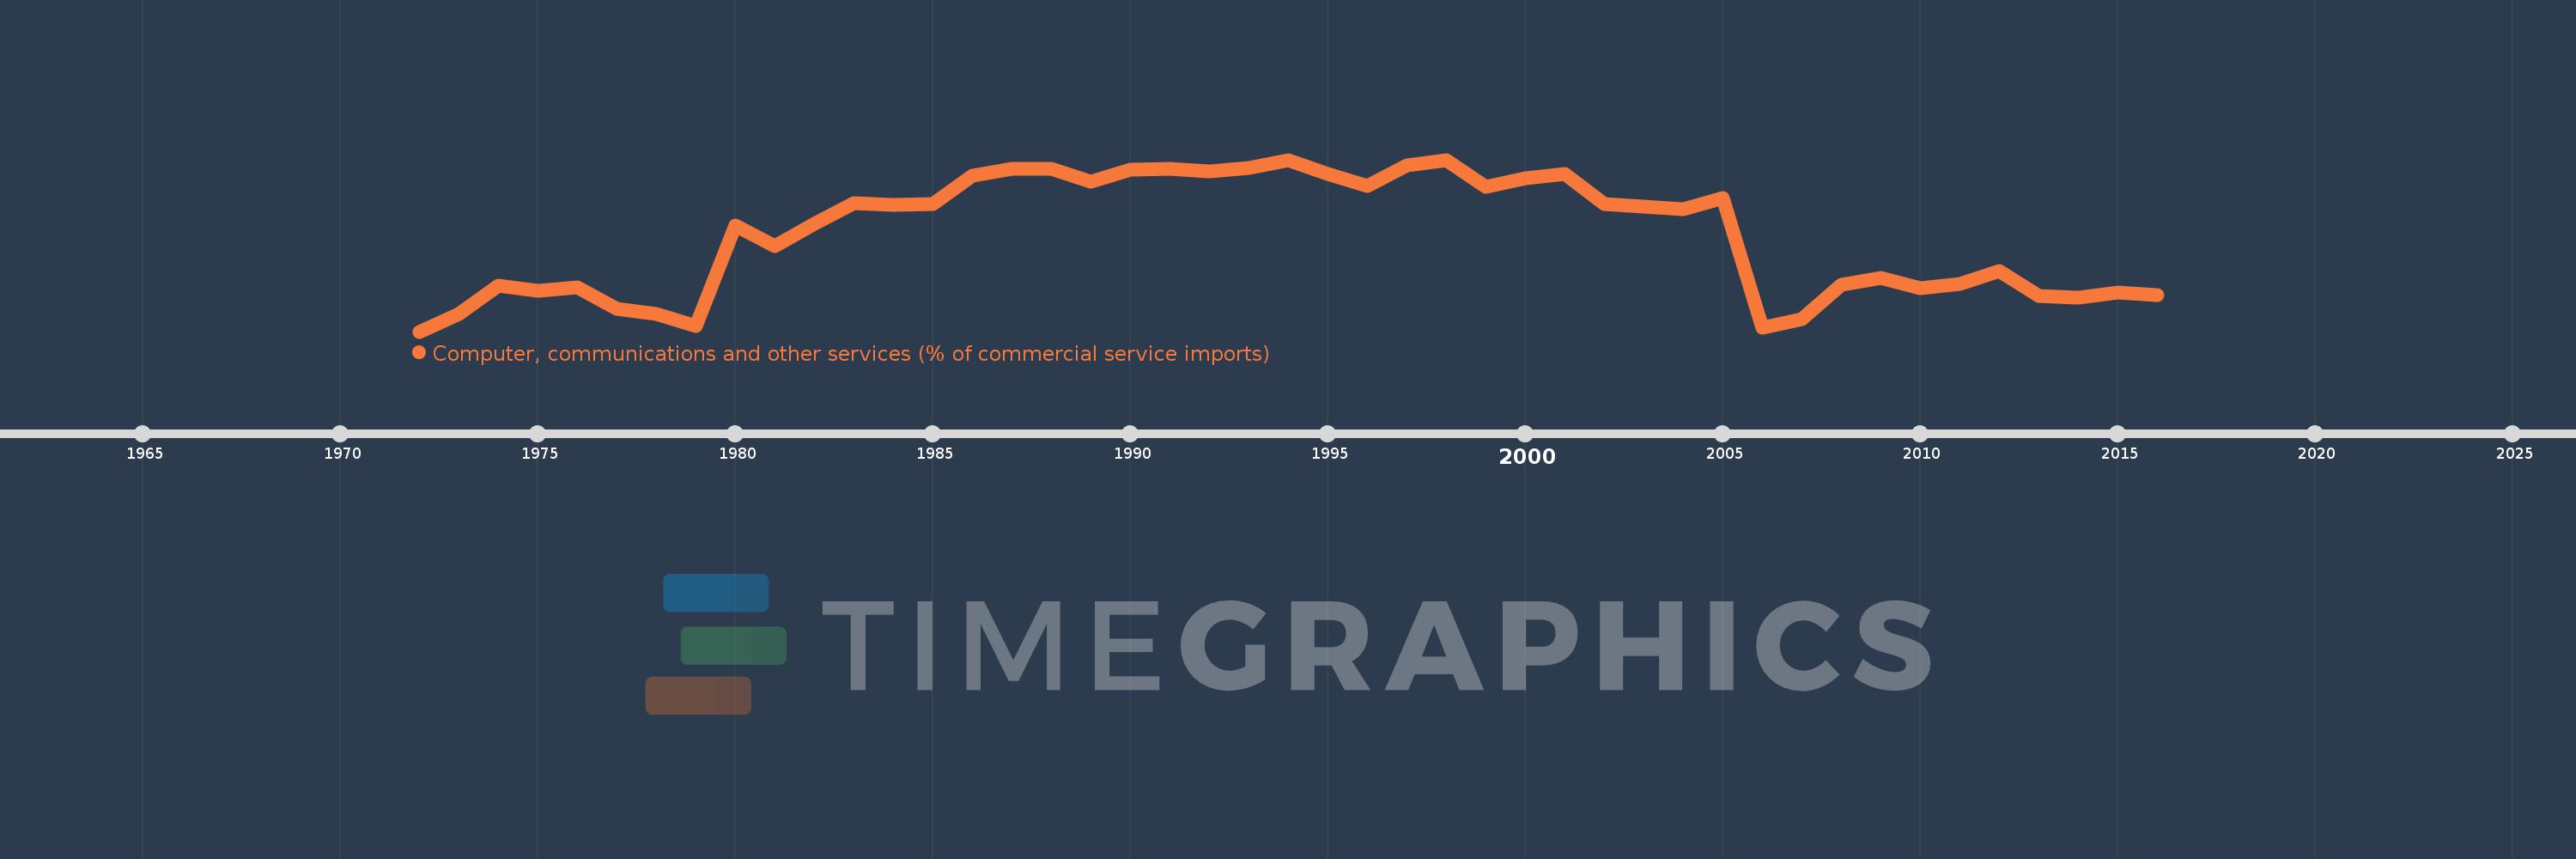
Computer, communications and other services (% of commercial service imports)
2016,2015,2014,2013,2012,2011,2010,2009,2008,2007,2006,2005,2004,2003,2002,2001,2000,1999,1998,1997,1996,1995,1994,1993,1992,1991,1990,1989,1988,1987,1986,1985,1984,1983,1982,1981,1980,1979,1978,1977,1976,1975,1974,1973,1972
Queste statistiche in altri paesi:
AfghanistanAlbaniaAlgeriaAngolaAntigua and BarbudaArab WorldArgentinaArmeniaArubaAustraliaAustriaAzerbaijanBahamas, TheBahrainBangladeshBarbadosBelarusBelgiumBelizeBeninBermudaBhutanBoliviaBosnia and HerzegovinaBotswanaBrazilBrunei DarussalamBulgariaBurkina FasoBurundiCabo VerdeCambodiaCameroonCanadaCaribbean small statesCentral African RepublicCentral Europe and the BalticsChadChileChinaColombiaComorosCongo, Dem. Rep.Congo, Rep.Costa RicaCote d'IvoireCroatiaCuracaoCyprusCzech RepublicDenmarkDjiboutiDominicaDominican RepublicEarly-demographic dividendEast Asia & PacificEast Asia & Pacific (excluding high income)East Asia & Pacific (IDA & IBRD countries)EcuadorEgypt, Arab Rep.El SalvadorEquatorial GuineaEritreaEstoniaEthiopiaEuro areaEurope & Central AsiaEurope & Central Asia (excluding high income)Europe & Central Asia (IDA & IBRD countries)European UnionFaroe IslandsFijiFinlandFragile and conflict affected situationsFranceFrench PolynesiaGabonGambia, TheGeorgiaGermanyGhanaGreeceGrenadaGuatemalaGuineaGuinea-BissauGuyanaHaitiHeavily indebted poor countries (HIPC)High incomeHondurasHong Kong SAR, ChinaHungaryIBRD onlyIcelandIDA & IBRD totalIDA onlyIDA totalIndiaIndonesiaIran, Islamic Rep.IraqIrelandIsraelItalyJamaicaJapanJordanKazakhstanKenyaKiribatiKorea, Rep.KosovoKuwaitKyrgyz RepublicLao PDRLate-demographic dividendLatin America & Caribbean Latin America & Caribbean (excluding high income)Latin America & the Caribbean (IDA & IBRD countries)LatviaLeast developed countries: UN classificationLebanonLesothoLiberiaLibyaLithuaniaLow & middle incomeLow incomeLower middle incomeLuxembourgMacao SAR, ChinaMacedonia, FYRMadagascarMalawiMalaysiaMaldivesMaliMaltaMarshall IslandsMauritaniaMauritiusMexicoMicronesia, Fed. Sts.Middle East & North AfricaMiddle East & North Africa (excluding high income)Middle East & North Africa (IDA & IBRD countries)Middle incomeMoldovaMongoliaMontenegroMoroccoMozambiqueMyanmarNamibiaNepalNetherlandsNew CaledoniaNew ZealandNicaraguaNigerNigeriaNorth AmericaNorwayOECD membersOmanOther small statesPacific island small statesPakistanPalauPanamaPapua New GuineaParaguayPeruPhilippinesPolandPortugalPost-demographic dividendPre-demographic dividendQatarRomaniaRussian FederationRwandaSamoaSao Tome and PrincipeSaudi ArabiaSenegalSerbiaSeychellesSierra LeoneSingaporeSint Maarten (Dutch part)Slovak RepublicSloveniaSmall statesSolomon IslandsSouth AfricaSouth AsiaSouth Asia (IDA & IBRD)South SudanSpainSri LankaSt. Kitts and NevisSt. LuciaSt. Vincent and the GrenadinesSub-Saharan Africa Sub-Saharan Africa (excluding high income)Sub-Saharan Africa (IDA & IBRD countries)SudanSurinameSwazilandSwedenSwitzerlandSyrian Arab RepublicTajikistanTanzaniaThailandTimor-LesteTogoTongaTrinidad and TobagoTunisiaTurkeyTuvaluUgandaUkraineUnited KingdomUnited StatesUpper middle incomeUruguayVanuatuVenezuela, RBWest Bank and GazaWorldYemen, Rep.ZambiaZimbabwe Linea del tempo:
Questa scala temporale mostra un grafico dal 1972 anno al 2016 anno. Saudi Arabia. I dati fino ad 1971 anno non disponibili. Il numero di osservazioni attuali secondo i date: 45.
La fonte (nome):
Indicatori dello sviluppo mondiale
La fonte (organizzazione):
International Monetary Fund, Balance of Payments Statistics Yearbook and data files.
Categorie:
Private Sector, Trade
sono stati aggiornati
23 apr 2017 anni
Indicatori delle variazioni dei valori per anni
Minima:
7.339
1 gen 1972 anni
Massimo:
83.533
1 gen 1998 anni
Alla data di osservazione
Valore
Variazione assoluta
La variazione rispetto al valore precedente
1 gen 1972 anni
7.339
+7.339
0.0%
1 gen 1973 anni
15.132
+7.792
106.17%
1 gen 1974 anni
27.615
+12.483
82.5%
1 gen 1975 anni
25.459
-2.156
-7.81%
1 gen 1976 anni
26.892
+1.433
5.63%
1 gen 1977 anni
17.424
-9.468
-35.21%
1 gen 1978 anni
15.334
-2.091
-12.0%
1 gen 1979 anni
9.702
-5.631
-36.72%
1 gen 1980 anni
54.301
+44.599
459.67%
1 gen 1981 anni
45.319
-8.982
-16.54%
1 gen 1982 anni
55.217
+9.897
21.84%
1 gen 1983 anni
64.298
+9.081
16.45%
1 gen 1984 anni
63.588
-0.709
-1.1%
1 gen 1985 anni
63.809
+0.221
0.35%
1 gen 1986 anni
76.428
+12.619
19.78%
1 gen 1987 anni
79.48
+3.052
3.99%
1 gen 1988 anni
79.674
+0.193
0.24%
1 gen 1989 anni
73.762
-5.911
-7.42%
1 gen 1990 anni
78.996
+5.234
7.1%
1 gen 1991 anni
79.68
+0.684
0.87%
1 gen 1992 anni
78.292
-1.388
-1.74%
1 gen 1993 anni
80.07
+1.778
2.27%
1 gen 1994 anni
83.28
+3.21
4.01%
1 gen 1995 anni
77.308
-5.971
-7.17%
1 gen 1996 anni
71.93
-5.379
-6.96%
1 gen 1997 anni
80.89
+8.96
12.46%
1 gen 1998 anni
83.533
+2.643
3.27%
1 gen 1999 anni
71.384
-12.149
-14.54%
1 gen 2000 anni
75.476
+4.092
5.73%
1 gen 2001 anni
77.183
+1.707
2.26%
1 gen 2002 anni
64.016
-13.167
-17.06%
1 gen 2003 anni
62.72
-1.295
-2.02%
1 gen 2004 anni
61.594
-1.126
-1.8%
1 gen 2005 anni
66.589
+4.995
8.11%
1 gen 2006 anni
9.05
-57.539
-86.41%
1 gen 2007 anni
12.705
+3.655
40.39%
1 gen 2008 anni
28.162
+15.457
121.66%
1 gen 2009 anni
31.185
+3.023
10.73%
1 gen 2010 anni
26.634
-4.552
-14.6%
1 gen 2011 anni
28.306
+1.673
6.28%
1 gen 2012 anni
34.15
+5.844
20.64%
1 gen 2013 anni
23.295
-10.855
-31.79%
1 gen 2014 anni
22.281
-1.014
-4.35%
1 gen 2015 anni
24.525
+2.244
10.07%
1 gen 2016 anni
23.549
-0.976
-3.98%
Classificazione dei paesi secondo i statistiche attuali per anni


Commenti: