29
/it/
it
AIzaSyAYiBZKx7MnpbEhh9jyipgxe19OcubqV5w
April 1, 2024
211492
Niger
NER
true
2
1
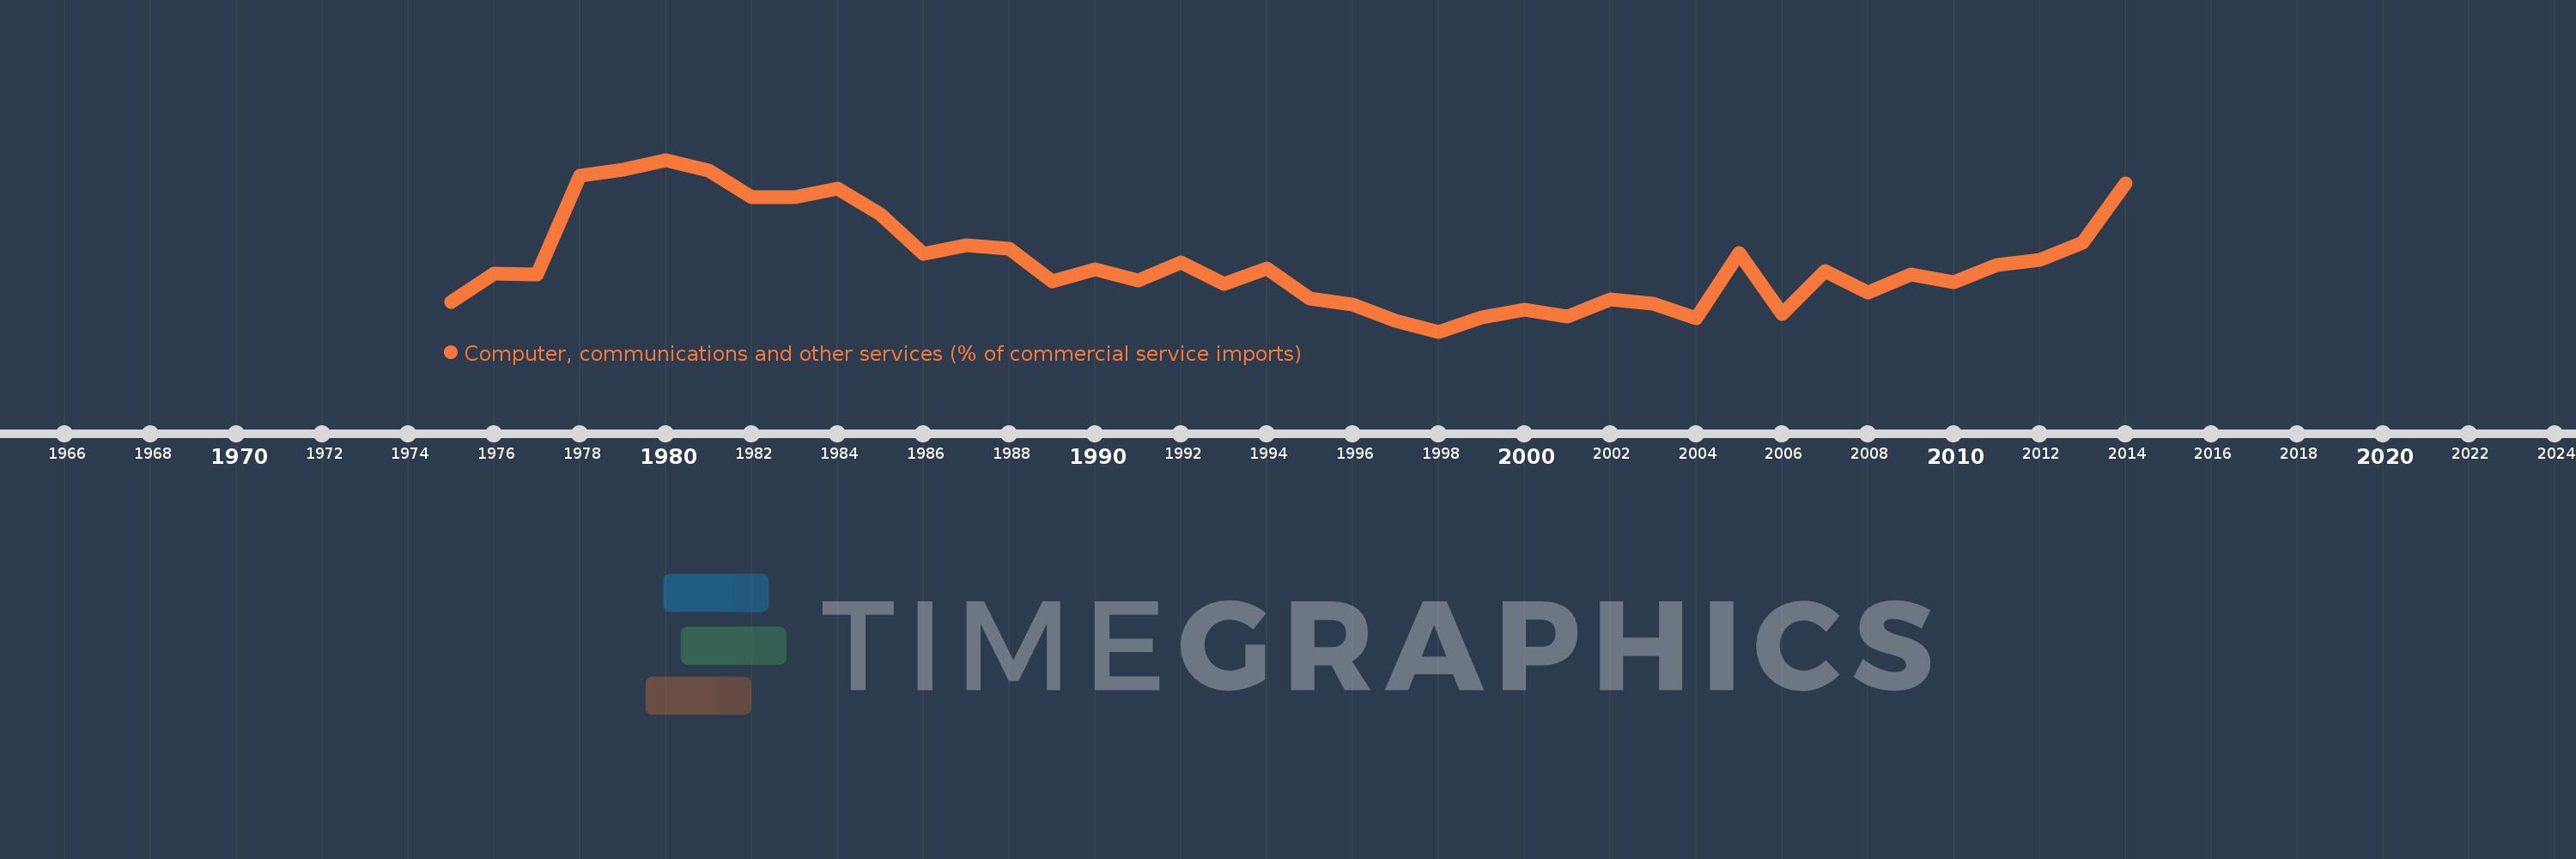
Computer, communications and other services (% of commercial service imports)
2014,2013,2012,2011,2010,2009,2008,2007,2006,2005,2004,2003,2002,2001,2000,1999,1998,1997,1996,1995,1994,1993,1992,1991,1990,1989,1988,1987,1986,1985,1984,1983,1982,1981,1980,1979,1978,1977,1976,1975
Queste statistiche in altri paesi:
AfghanistanAlbaniaAlgeriaAngolaAntigua and BarbudaArab WorldArgentinaArmeniaArubaAustraliaAustriaAzerbaijanBahamas, TheBahrainBangladeshBarbadosBelarusBelgiumBelizeBeninBermudaBhutanBoliviaBosnia and HerzegovinaBotswanaBrazilBrunei DarussalamBulgariaBurkina FasoBurundiCabo VerdeCambodiaCameroonCanadaCaribbean small statesCentral African RepublicCentral Europe and the BalticsChadChileChinaColombiaComorosCongo, Dem. Rep.Congo, Rep.Costa RicaCote d'IvoireCroatiaCuracaoCyprusCzech RepublicDenmarkDjiboutiDominicaDominican RepublicEarly-demographic dividendEast Asia & PacificEast Asia & Pacific (excluding high income)East Asia & Pacific (IDA & IBRD countries)EcuadorEgypt, Arab Rep.El SalvadorEquatorial GuineaEritreaEstoniaEthiopiaEuro areaEurope & Central AsiaEurope & Central Asia (excluding high income)Europe & Central Asia (IDA & IBRD countries)European UnionFaroe IslandsFijiFinlandFragile and conflict affected situationsFranceFrench PolynesiaGabonGambia, TheGeorgiaGermanyGhanaGreeceGrenadaGuatemalaGuineaGuinea-BissauGuyanaHaitiHeavily indebted poor countries (HIPC)High incomeHondurasHong Kong SAR, ChinaHungaryIBRD onlyIcelandIDA & IBRD totalIDA onlyIDA totalIndiaIndonesiaIran, Islamic Rep.IraqIrelandIsraelItalyJamaicaJapanJordanKazakhstanKenyaKiribatiKorea, Rep.KosovoKuwaitKyrgyz RepublicLao PDRLate-demographic dividendLatin America & Caribbean Latin America & Caribbean (excluding high income)Latin America & the Caribbean (IDA & IBRD countries)LatviaLeast developed countries: UN classificationLebanonLesothoLiberiaLibyaLithuaniaLow & middle incomeLow incomeLower middle incomeLuxembourgMacao SAR, ChinaMacedonia, FYRMadagascarMalawiMalaysiaMaldivesMaliMaltaMarshall IslandsMauritaniaMauritiusMexicoMicronesia, Fed. Sts.Middle East & North AfricaMiddle East & North Africa (excluding high income)Middle East & North Africa (IDA & IBRD countries)Middle incomeMoldovaMongoliaMontenegroMoroccoMozambiqueMyanmarNamibiaNepalNetherlandsNew CaledoniaNew ZealandNicaraguaNigerNigeriaNorth AmericaNorwayOECD membersOmanOther small statesPacific island small statesPakistanPalauPanamaPapua New GuineaParaguayPeruPhilippinesPolandPortugalPost-demographic dividendPre-demographic dividendQatarRomaniaRussian FederationRwandaSamoaSao Tome and PrincipeSaudi ArabiaSenegalSerbiaSeychellesSierra LeoneSingaporeSint Maarten (Dutch part)Slovak RepublicSloveniaSmall statesSolomon IslandsSouth AfricaSouth AsiaSouth Asia (IDA & IBRD)South SudanSpainSri LankaSt. Kitts and NevisSt. LuciaSt. Vincent and the GrenadinesSub-Saharan Africa Sub-Saharan Africa (excluding high income)Sub-Saharan Africa (IDA & IBRD countries)SudanSurinameSwazilandSwedenSwitzerlandSyrian Arab RepublicTajikistanTanzaniaThailandTimor-LesteTogoTongaTrinidad and TobagoTunisiaTurkeyTuvaluUgandaUkraineUnited KingdomUnited StatesUpper middle incomeUruguayVanuatuVenezuela, RBWest Bank and GazaWorldYemen, Rep.ZambiaZimbabwe Linea del tempo:
Questa scala temporale mostra un grafico dal 1975 anno al 2014 anno. Niger. I dati fino ad 1974 anno non disponibili. Il numero di osservazioni attuali secondo i date: 40.
La fonte (nome):
Indicatori dello sviluppo mondiale
La fonte (organizzazione):
International Monetary Fund, Balance of Payments Statistics Yearbook and data files.
Categorie:
Private Sector, Trade
sono stati aggiornati
23 apr 2017 anni
Indicatori delle variazioni dei valori per anni
Minima:
6.186
1 gen 1998 anni
Massimo:
43.02
1 gen 1980 anni
Alla data di osservazione
Valore
Variazione assoluta
La variazione rispetto al valore precedente
1 gen 1975 anni
12.502
+12.502
0.0%
1 gen 1976 anni
18.577
+6.075
48.59%
1 gen 1977 anni
18.481
-0.096
-0.52%
1 gen 1978 anni
39.593
+21.112
114.23%
1 gen 1979 anni
40.874
+1.281
3.24%
1 gen 1980 anni
43.02
+2.146
5.25%
1 gen 1981 anni
40.703
-2.317
-5.39%
1 gen 1982 anni
35.085
-5.618
-13.8%
1 gen 1983 anni
34.989
-0.095
-0.27%
1 gen 1984 anni
36.847
+1.857
5.31%
1 gen 1985 anni
31.374
-5.473
-14.85%
1 gen 1986 anni
22.916
-8.458
-26.96%
1 gen 1987 anni
24.714
+1.798
7.85%
1 gen 1988 anni
23.996
-0.718
-2.91%
1 gen 1989 anni
17.036
-6.959
-29.0%
1 gen 1990 anni
19.574
+2.537
14.89%
1 gen 1991 anni
17.098
-2.476
-12.65%
1 gen 1992 anni
21.044
+3.947
23.08%
1 gen 1993 anni
16.474
-4.57
-21.72%
1 gen 1994 anni
19.635
+3.161
19.19%
1 gen 1995 anni
13.29
-6.345
-32.32%
1 gen 1996 anni
11.957
-1.333
-10.03%
1 gen 1997 anni
8.52
-3.437
-28.74%
1 gen 1998 anni
6.186
-2.334
-27.4%
1 gen 1999 anni
9.218
+3.032
49.01%
1 gen 2000 anni
10.872
+1.654
17.95%
1 gen 2001 anni
9.324
-1.548
-14.24%
1 gen 2002 anni
13.131
+3.806
40.82%
1 gen 2003 anni
12.21
-0.92
-7.01%
1 gen 2004 anni
9.1
-3.11
-25.47%
1 gen 2005 anni
23.018
+13.918
152.94%
1 gen 2006 anni
10.049
-12.969
-56.34%
1 gen 2007 anni
19.199
+9.15
91.05%
1 gen 2008 anni
14.494
-4.705
-24.51%
1 gen 2009 anni
18.357
+3.862
26.65%
1 gen 2010 anni
16.727
-1.63
-8.88%
1 gen 2011 anni
20.399
+3.673
21.96%
1 gen 2012 anni
21.515
+1.116
5.47%
1 gen 2013 anni
25.283
+3.768
17.51%
1 gen 2014 anni
37.965
+12.683
50.16%
Classificazione dei paesi secondo i statistiche attuali per anni


Commenti: