29
/it/
it
AIzaSyAYiBZKx7MnpbEhh9jyipgxe19OcubqV5w
April 1, 2024
171532
Kuwait
KWT
true
2
1
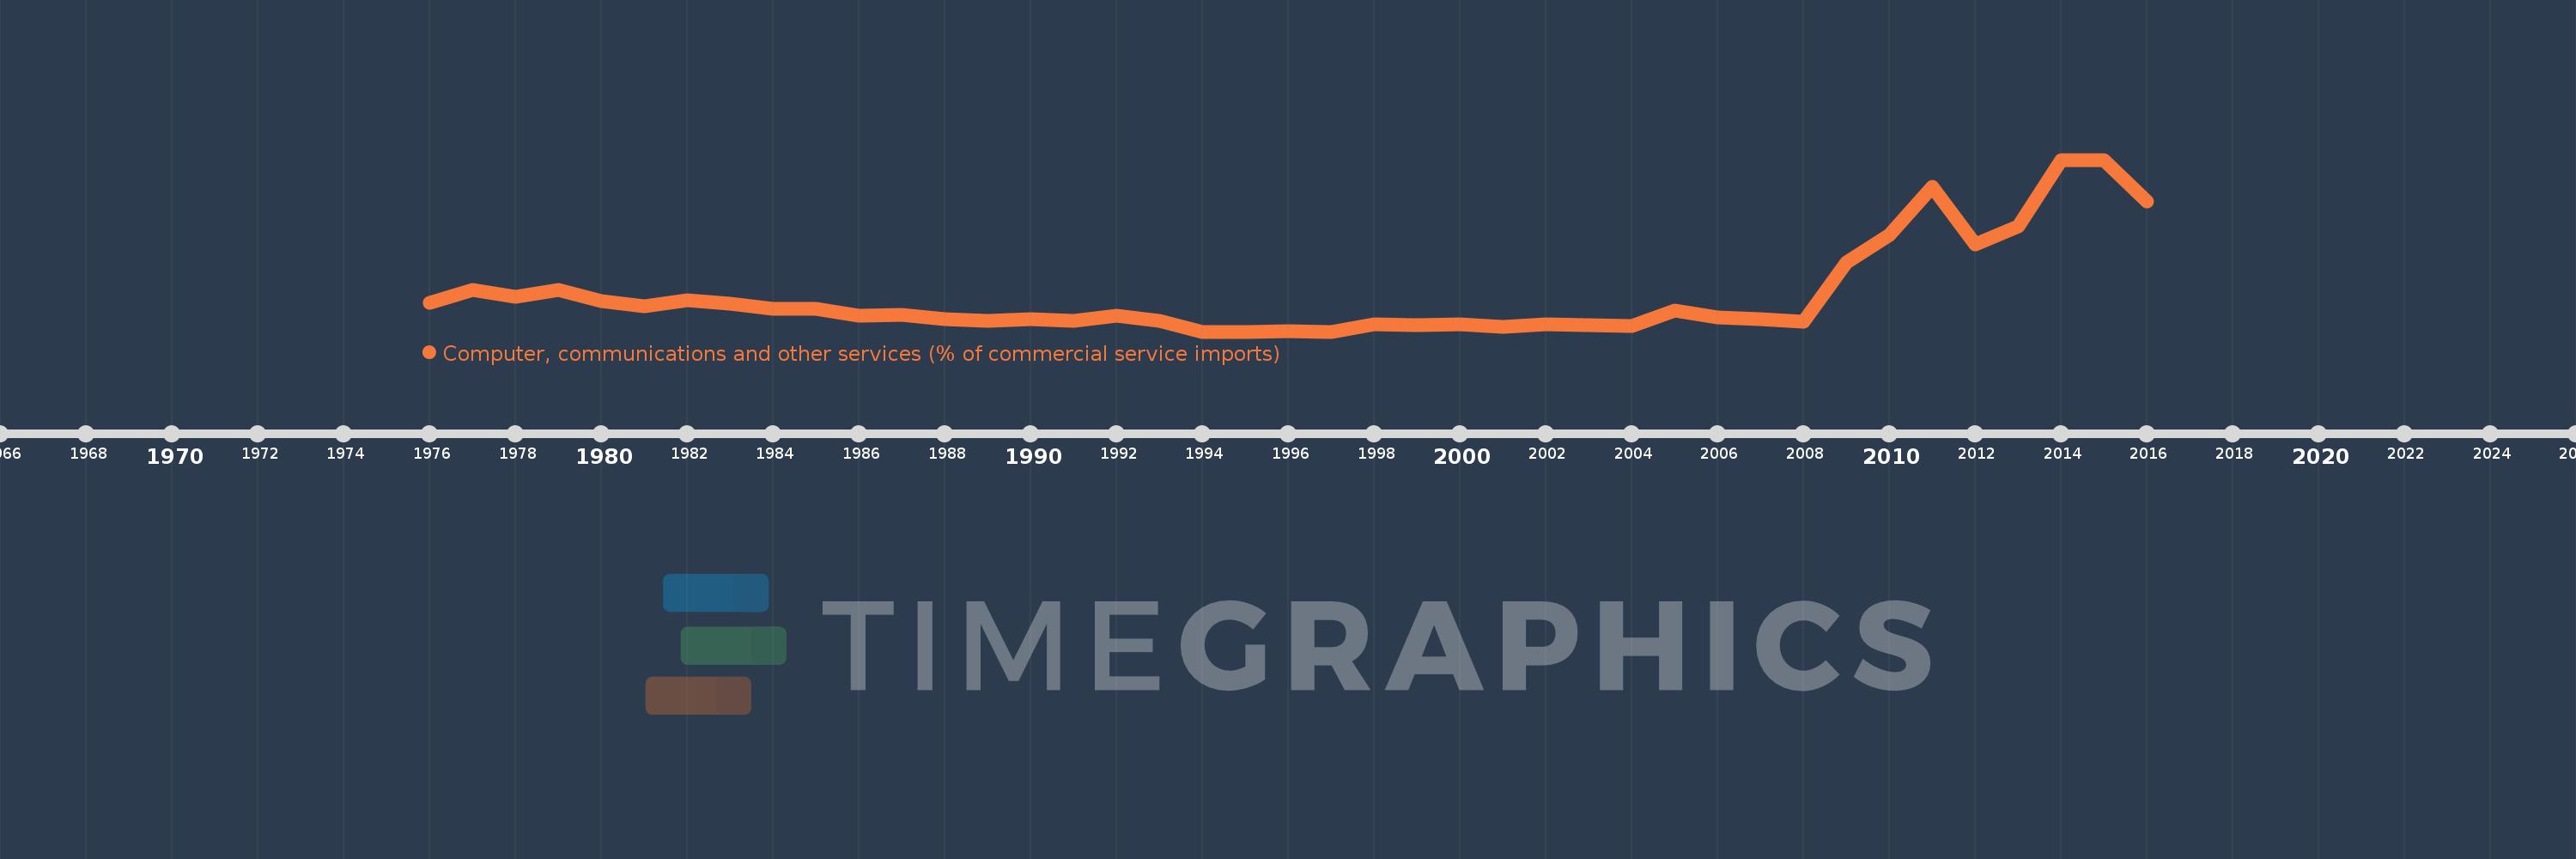
Computer, communications and other services (% of commercial service imports)
2016,2015,2014,2013,2012,2011,2010,2009,2008,2007,2006,2005,2004,2003,2002,2001,2000,1999,1998,1997,1996,1995,1994,1993,1992,1991,1990,1989,1988,1987,1986,1985,1984,1983,1982,1981,1980,1979,1978,1977,1976
Queste statistiche in altri paesi:
AfghanistanAlbaniaAlgeriaAngolaAntigua and BarbudaArab WorldArgentinaArmeniaArubaAustraliaAustriaAzerbaijanBahamas, TheBahrainBangladeshBarbadosBelarusBelgiumBelizeBeninBermudaBhutanBoliviaBosnia and HerzegovinaBotswanaBrazilBrunei DarussalamBulgariaBurkina FasoBurundiCabo VerdeCambodiaCameroonCanadaCaribbean small statesCentral African RepublicCentral Europe and the BalticsChadChileChinaColombiaComorosCongo, Dem. Rep.Congo, Rep.Costa RicaCote d'IvoireCroatiaCuracaoCyprusCzech RepublicDenmarkDjiboutiDominicaDominican RepublicEarly-demographic dividendEast Asia & PacificEast Asia & Pacific (excluding high income)East Asia & Pacific (IDA & IBRD countries)EcuadorEgypt, Arab Rep.El SalvadorEquatorial GuineaEritreaEstoniaEthiopiaEuro areaEurope & Central AsiaEurope & Central Asia (excluding high income)Europe & Central Asia (IDA & IBRD countries)European UnionFaroe IslandsFijiFinlandFragile and conflict affected situationsFranceFrench PolynesiaGabonGambia, TheGeorgiaGermanyGhanaGreeceGrenadaGuatemalaGuineaGuinea-BissauGuyanaHaitiHeavily indebted poor countries (HIPC)High incomeHondurasHong Kong SAR, ChinaHungaryIBRD onlyIcelandIDA & IBRD totalIDA onlyIDA totalIndiaIndonesiaIran, Islamic Rep.IraqIrelandIsraelItalyJamaicaJapanJordanKazakhstanKenyaKiribatiKorea, Rep.KosovoKuwaitKyrgyz RepublicLao PDRLate-demographic dividendLatin America & Caribbean Latin America & Caribbean (excluding high income)Latin America & the Caribbean (IDA & IBRD countries)LatviaLeast developed countries: UN classificationLebanonLesothoLiberiaLibyaLithuaniaLow & middle incomeLow incomeLower middle incomeLuxembourgMacao SAR, ChinaMacedonia, FYRMadagascarMalawiMalaysiaMaldivesMaliMaltaMarshall IslandsMauritaniaMauritiusMexicoMicronesia, Fed. Sts.Middle East & North AfricaMiddle East & North Africa (excluding high income)Middle East & North Africa (IDA & IBRD countries)Middle incomeMoldovaMongoliaMontenegroMoroccoMozambiqueMyanmarNamibiaNepalNetherlandsNew CaledoniaNew ZealandNicaraguaNigerNigeriaNorth AmericaNorwayOECD membersOmanOther small statesPacific island small statesPakistanPalauPanamaPapua New GuineaParaguayPeruPhilippinesPolandPortugalPost-demographic dividendPre-demographic dividendQatarRomaniaRussian FederationRwandaSamoaSao Tome and PrincipeSaudi ArabiaSenegalSerbiaSeychellesSierra LeoneSingaporeSint Maarten (Dutch part)Slovak RepublicSloveniaSmall statesSolomon IslandsSouth AfricaSouth AsiaSouth Asia (IDA & IBRD)South SudanSpainSri LankaSt. Kitts and NevisSt. LuciaSt. Vincent and the GrenadinesSub-Saharan Africa Sub-Saharan Africa (excluding high income)Sub-Saharan Africa (IDA & IBRD countries)SudanSurinameSwazilandSwedenSwitzerlandSyrian Arab RepublicTajikistanTanzaniaThailandTimor-LesteTogoTongaTrinidad and TobagoTunisiaTurkeyTuvaluUgandaUkraineUnited KingdomUnited StatesUpper middle incomeUruguayVanuatuVenezuela, RBWest Bank and GazaWorldYemen, Rep.ZambiaZimbabwe Linea del tempo:
Questa scala temporale mostra un grafico dal 1976 anno al 2016 anno. Kuwait. I dati fino ad 1975 anno non disponibili. Il numero di osservazioni attuali secondo i date: 41.
La fonte (nome):
Indicatori dello sviluppo mondiale
La fonte (organizzazione):
International Monetary Fund, Balance of Payments Statistics Yearbook and data files.
Categorie:
Private Sector, Trade
sono stati aggiornati
23 apr 2017 anni
Indicatori delle variazioni dei valori per anni
Minima:
0.0
1 gen 1994 anni
Massimo:
21.828
1 gen 2014 anni
Alla data di osservazione
Valore
Variazione assoluta
La variazione rispetto al valore precedente
1 gen 1976 anni
3.684
+3.684
0.0%
1 gen 1977 anni
5.263
+1.579
42.86%
1 gen 1978 anni
4.464
-0.799
-15.18%
1 gen 1979 anni
5.278
+0.813
18.22%
1 gen 1980 anni
3.876
-1.402
-26.56%
1 gen 1981 anni
3.23
-0.646
-16.66%
1 gen 1982 anni
3.953
+0.723
22.38%
1 gen 1983 anni
3.567
-0.386
-9.76%
1 gen 1984 anni
2.844
-0.724
-20.28%
1 gen 1985 anni
2.867
+0.023
0.82%
1 gen 1986 anni
2.006
-0.861
-30.03%
1 gen 1987 anni
2.081
+0.075
3.74%
1 gen 1988 anni
1.577
-0.504
-24.21%
1 gen 1989 anni
1.375
-0.202
-12.81%
1 gen 1990 anni
1.543
+0.168
12.19%
1 gen 1991 anni
1.36
-0.183
-11.87%
1 gen 1992 anni
2.059
+0.7
51.47%
1 gen 1993 anni
1.354
-0.705
-34.25%
1 gen 1994 anni
0.0
-1.354
-100.0%
1 gen 1995 anni
0.0
+0.0
-150.0%
1 gen 1996 anni
0.105
+0.105
184.89 Trln%
1 gen 1997 anni
0.0
-0.105
-100.0%
1 gen 1998 anni
0.976
+0.976
3432.62 Trln%
1 gen 1999 anni
0.773
-0.203
-20.8%
1 gen 2000 anni
0.934
+0.162
20.92%
1 gen 2001 anni
0.634
-0.301
-32.16%
1 gen 2002 anni
0.895
+0.261
41.13%
1 gen 2003 anni
0.836
-0.059
-6.55%
1 gen 2004 anni
0.752
-0.084
-10.05%
1 gen 2005 anni
2.648
+1.896
252.22%
1 gen 2006 anni
1.85
-0.799
-30.16%
1 gen 2007 anni
1.534
-0.315
-17.05%
1 gen 2008 anni
1.274
-0.26
-16.96%
1 gen 2009 anni
8.747
+7.473
586.57%
1 gen 2010 anni
12.28
+3.533
40.39%
1 gen 2011 anni
18.433
+6.152
50.1%
1 gen 2012 anni
11.101
-7.331
-39.77%
1 gen 2013 anni
13.421
+2.319
20.89%
1 gen 2014 anni
21.828
+8.407
62.64%
1 gen 2015 anni
21.724
-0.104
-0.47%
1 gen 2016 anni
16.549
-5.175
-23.82%
Classificazione dei paesi secondo i statistiche attuali per anni


Commenti: