29
/it/
it
AIzaSyAYiBZKx7MnpbEhh9jyipgxe19OcubqV5w
April 1, 2024
79266
Barbados
BRB
true
2
1
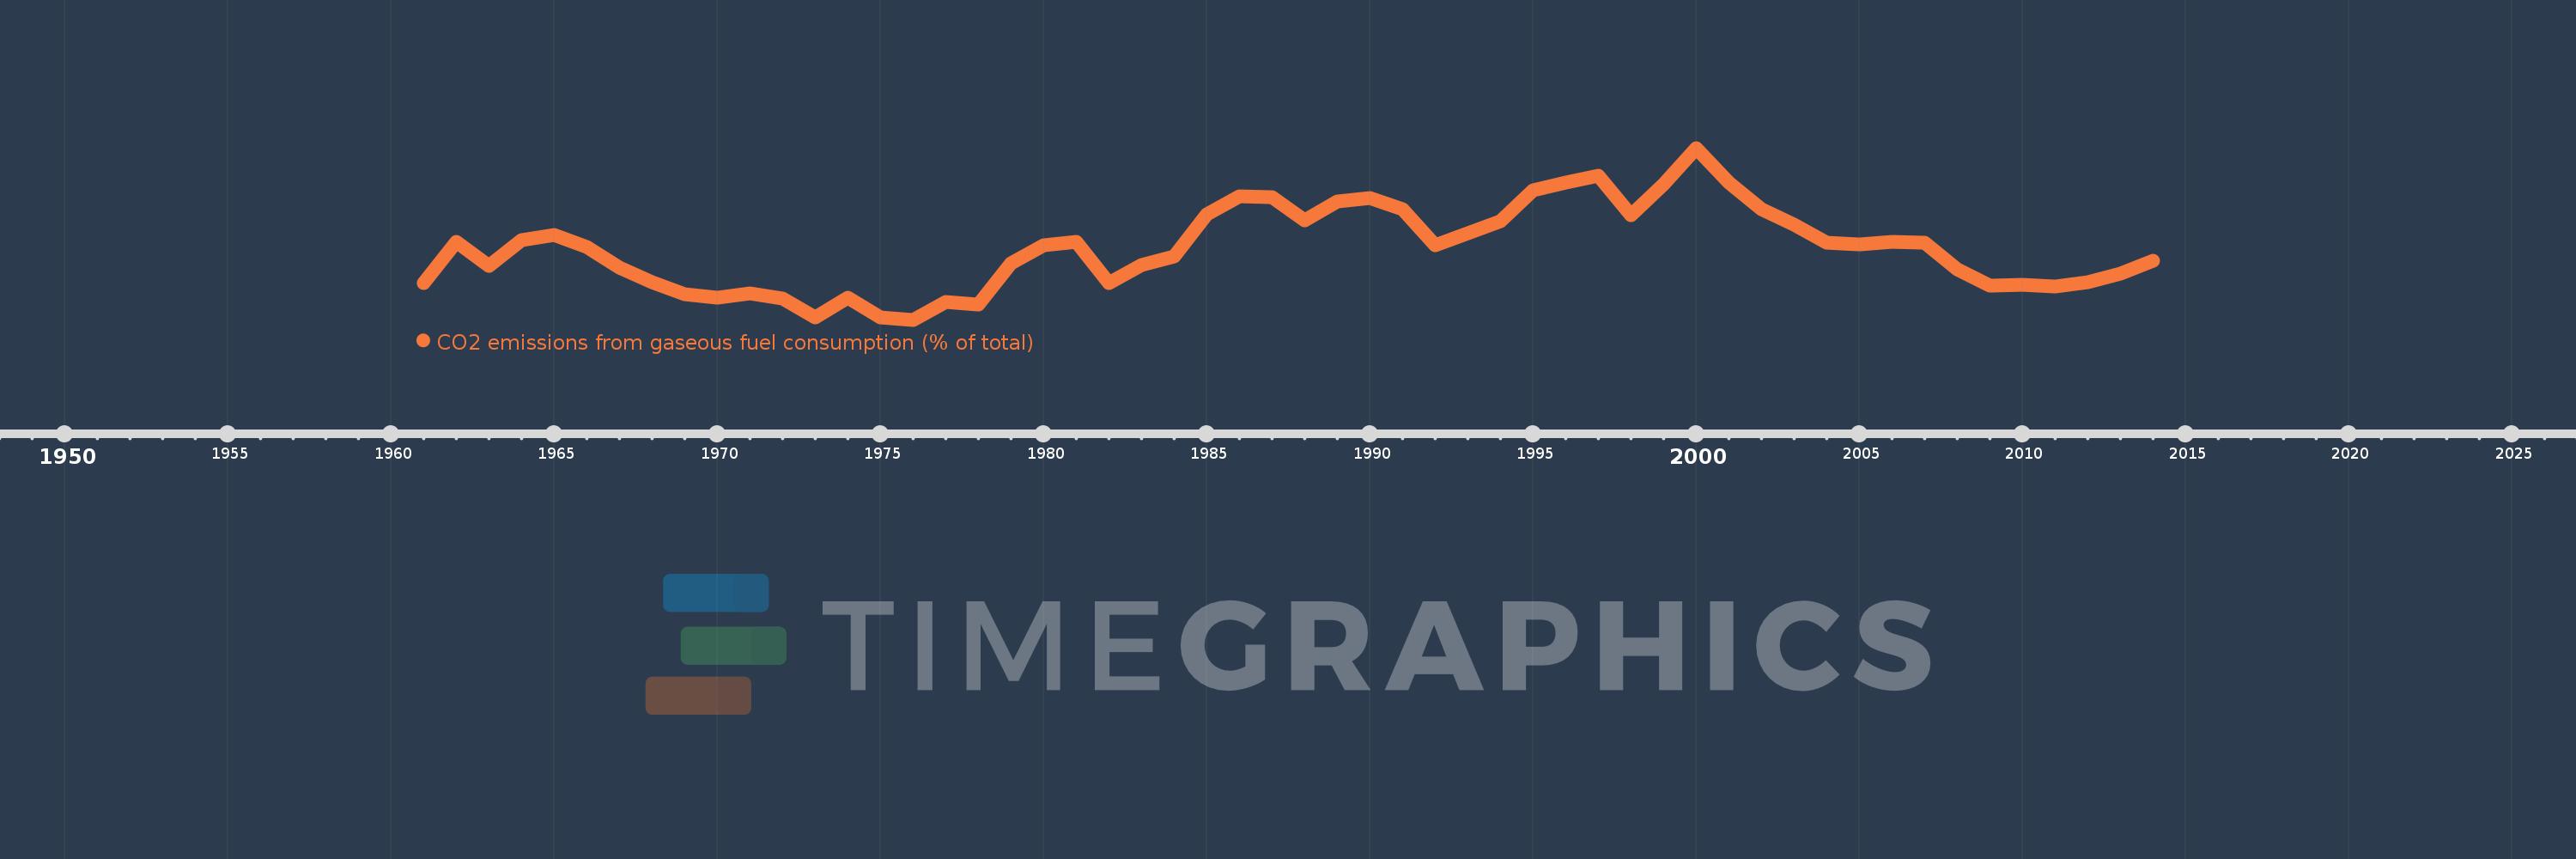
CO2 emissions from gaseous fuel consumption (% of total)
2014,2013,2012,2011,2010,2009,2008,2007,2006,2005,2004,2003,2002,2001,2000,1999,1998,1997,1996,1995,1994,1993,1992,1991,1990,1989,1988,1987,1986,1985,1984,1983,1982,1981,1980,1979,1978,1977,1976,1975,1974,1973,1972,1971,1970,1969,1968,1967,1966,1965,1964,1963,1962,1961
Queste statistiche in altri paesi:
AfghanistanAlbaniaAlgeriaAndorraAngolaAntigua and BarbudaArab WorldArgentinaArmeniaArubaAustraliaAustriaAzerbaijanBahamas, TheBahrainBangladeshBarbadosBelarusBelgiumBelizeBeninBermudaBhutanBoliviaBosnia and HerzegovinaBotswanaBrazilBritish Virgin IslandsBrunei DarussalamBulgariaBurkina FasoBurundiCabo VerdeCambodiaCameroonCanadaCaribbean small statesCayman IslandsCentral African RepublicCentral Europe and the BalticsChadChileChinaColombiaComorosCongo, Dem. Rep.Congo, Rep.Costa RicaCote d'IvoireCroatiaCubaCuracaoCyprusCzech RepublicDenmarkDjiboutiDominicaDominican RepublicEarly-demographic dividendEast Asia & PacificEast Asia & Pacific (excluding high income)East Asia & Pacific (IDA & IBRD countries)EcuadorEgypt, Arab Rep.El SalvadorEquatorial GuineaEritreaEstoniaEthiopiaEuro areaEurope & Central AsiaEurope & Central Asia (excluding high income)Europe & Central Asia (IDA & IBRD countries)European UnionFaroe IslandsFijiFinlandFragile and conflict affected situationsFranceFrench PolynesiaGabonGambia, TheGeorgiaGermanyGhanaGibraltarGreeceGreenlandGrenadaGuatemalaGuineaGuinea-BissauGuyanaHaitiHeavily indebted poor countries (HIPC)High incomeHondurasHong Kong SAR, ChinaHungaryIBRD onlyIcelandIDA & IBRD totalIDA blendIDA onlyIDA totalIndiaIndonesiaIran, Islamic Rep.IraqIrelandIsraelItalyJamaicaJapanJordanKazakhstanKenyaKiribatiKorea, Dem. People’s Rep.Korea, Rep.KuwaitKyrgyz RepublicLao PDRLate-demographic dividendLatin America & Caribbean Latin America & Caribbean (excluding high income)Latin America & the Caribbean (IDA & IBRD countries)LatviaLeast developed countries: UN classificationLebanonLesothoLiberiaLibyaLiechtensteinLithuaniaLow & middle incomeLow incomeLower middle incomeLuxembourgMacao SAR, ChinaMacedonia, FYRMadagascarMalawiMalaysiaMaldivesMaliMaltaMarshall IslandsMauritaniaMauritiusMexicoMicronesia, Fed. Sts.Middle East & North AfricaMiddle East & North Africa (excluding high income)Middle East & North Africa (IDA & IBRD countries)Middle incomeMoldovaMongoliaMontenegroMoroccoMozambiqueMyanmarNamibiaNauruNepalNetherlandsNew CaledoniaNew ZealandNicaraguaNigerNigeriaNorth AmericaNorwayOECD membersOmanOther small statesPacific island small statesPakistanPalauPanamaPapua New GuineaParaguayPeruPhilippinesPolandPortugalPost-demographic dividendPre-demographic dividendQatarRomaniaRussian FederationRwandaSamoaSao Tome and PrincipeSaudi ArabiaSenegalSerbiaSeychellesSierra LeoneSingaporeSint Maarten (Dutch part)Slovak RepublicSloveniaSmall statesSolomon IslandsSomaliaSouth AfricaSouth AsiaSouth Asia (IDA & IBRD)South SudanSpainSri LankaSt. Kitts and NevisSt. LuciaSt. Vincent and the GrenadinesSub-Saharan Africa Sub-Saharan Africa (excluding high income)Sub-Saharan Africa (IDA & IBRD countries)SudanSurinameSwazilandSwedenSwitzerlandSyrian Arab RepublicTajikistanTanzaniaThailandTimor-LesteTogoTongaTrinidad and TobagoTunisiaTurkeyTurkmenistanTurks and Caicos IslandsUgandaUkraineUnited Arab EmiratesUnited KingdomUnited StatesUpper middle incomeUruguayUzbekistanVanuatuVenezuela, RBVietnamWest Bank and GazaWorldYemen, Rep.ZambiaZimbabwe Linea del tempo:
Questa scala temporale mostra un grafico dal 1961 anno al 2014 anno. Barbados. I dati fino ad 1960 anno non disponibili. Il numero di osservazioni attuali secondo i date: 54.
La fonte (nome):
Indicatori dello sviluppo mondiale
La fonte (organizzazione):
Carbon Dioxide Information Analysis Center, Environmental Sciences Division, Oak Ridge National Laboratory, Tennessee, United States.
Categorie:
Energy & Mining, Climate Change, Environment
sono stati aggiornati
23 apr 2017 anni
Indicatori delle variazioni dei valori per anni
Minima:
0.645
1 gen 1976 anni
Massimo:
7.576
1 gen 2000 anni
Alla data di osservazione
Valore
Variazione assoluta
La variazione rispetto al valore precedente
1 gen 1961 anni
2.128
+2.128
0.0%
1 gen 1962 anni
3.774
+1.646
77.36%
1 gen 1963 anni
2.817
-0.957
-25.35%
1 gen 1964 anni
3.846
+1.029
36.54%
1 gen 1965 anni
4.082
+0.235
6.12%
1 gen 1966 anni
3.571
-0.51
-12.5%
1 gen 1967 anni
2.74
-0.832
-23.29%
1 gen 1968 anni
2.174
-0.566
-20.65%
1 gen 1969 anni
1.667
-0.507
-23.33%
1 gen 1970 anni
1.527
-0.14
-8.4%
1 gen 1971 anni
1.709
+0.183
11.97%
1 gen 1972 anni
1.515
-0.194
-11.36%
1 gen 1973 anni
0.73
-0.785
-51.82%
1 gen 1974 anni
1.527
+0.797
109.16%
1 gen 1975 anni
0.746
-0.78
-51.12%
1 gen 1976 anni
0.645
-0.101
-13.55%
1 gen 1977 anni
1.379
+0.734
113.79%
1 gen 1978 anni
1.242
-0.137
-9.94%
1 gen 1979 anni
2.907
+1.665
134.01%
1 gen 1980 anni
3.659
+0.752
25.85%
1 gen 1981 anni
3.804
+0.146
3.99%
1 gen 1982 anni
2.139
-1.665
-43.77%
1 gen 1983 anni
2.841
+0.702
32.81%
1 gen 1984 anni
3.209
+0.368
12.94%
1 gen 1985 anni
4.902
+1.693
52.78%
1 gen 1986 anni
5.628
+0.726
14.81%
1 gen 1987 anni
5.6
-0.028
-0.49%
1 gen 1988 anni
4.669
-0.931
-16.62%
1 gen 1989 anni
5.426
+0.757
16.21%
1 gen 1990 anni
5.556
+0.129
2.38%
1 gen 1991 anni
5.119
-0.436
-7.85%
1 gen 1992 anni
3.647
-1.472
-28.75%
1 gen 1993 anni
4.12
+0.472
12.95%
1 gen 1994 anni
4.605
+0.485
11.78%
1 gen 1995 anni
5.882
+1.277
27.73%
1 gen 1996 anni
6.195
+0.312
5.31%
1 gen 1997 anni
6.466
+0.271
4.37%
1 gen 1998 anni
4.878
-1.587
-24.55%
1 gen 1999 anni
6.109
+1.231
25.24%
1 gen 2000 anni
7.576
+1.466
24.0%
1 gen 2001 anni
6.173
-1.403
-18.52%
1 gen 2002 anni
5.105
-1.068
-17.3%
1 gen 2003 anni
4.478
-0.627
-12.29%
1 gen 2004 anni
3.757
-0.72
-16.09%
1 gen 2005 anni
3.683
-0.075
-1.98%
1 gen 2006 anni
3.794
+0.111
3.02%
1 gen 2007 anni
3.743
-0.051
-1.34%
1 gen 2008 anni
2.688
-1.055
-28.19%
1 gen 2009 anni
2.036
-0.652
-24.25%
1 gen 2010 anni
2.041
+0.005
0.23%
1 gen 2011 anni
1.985
-0.056
-2.73%
1 gen 2012 anni
2.158
+0.173
8.72%
1 gen 2013 anni
2.494
+0.335
15.54%
1 gen 2014 anni
3.038
+0.544
21.82%
Classificazione dei paesi secondo i statistiche attuali per anni


Commenti: