29
/it/
it
AIzaSyAYiBZKx7MnpbEhh9jyipgxe19OcubqV5w
April 1, 2024
154342
India
IND
true
2
1
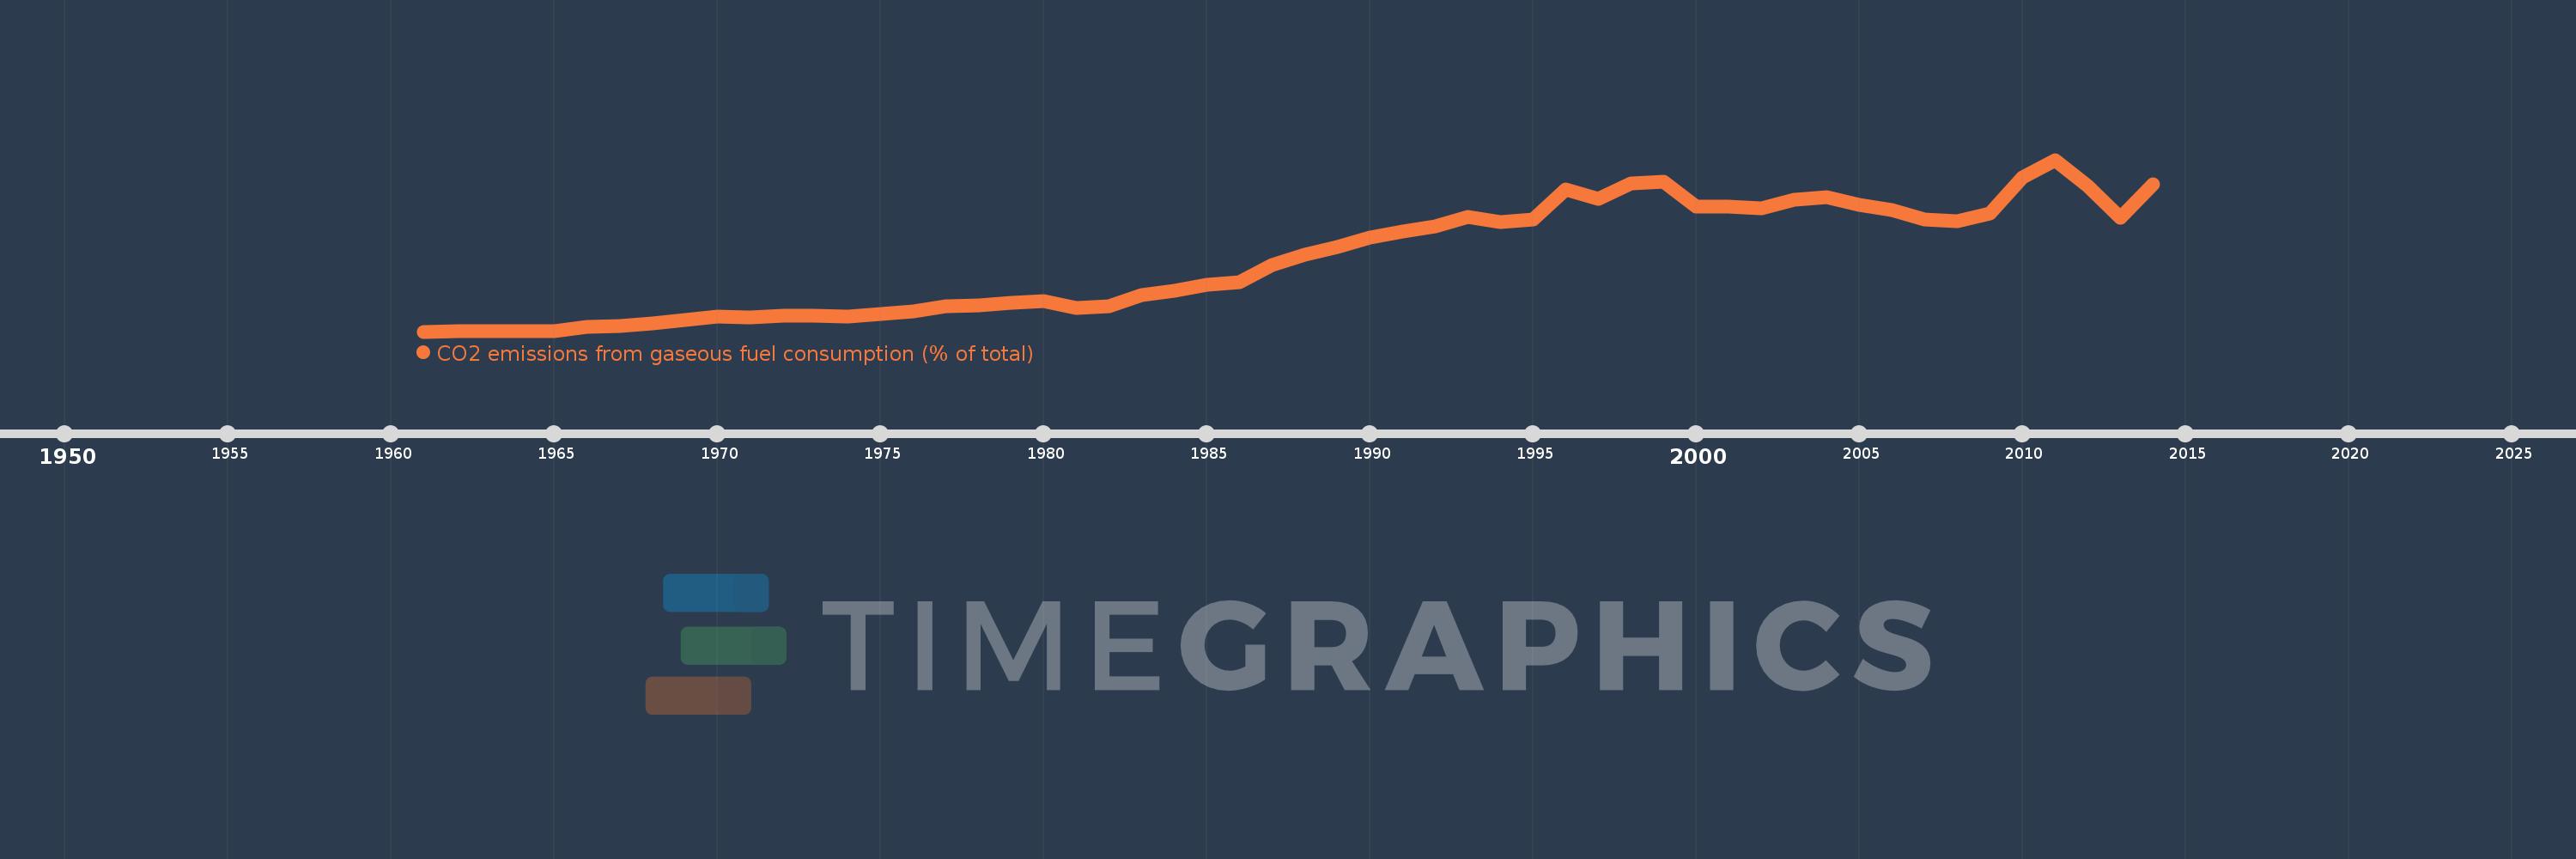
CO2 emissions from gaseous fuel consumption (% of total)
2014,2013,2012,2011,2010,2009,2008,2007,2006,2005,2004,2003,2002,2001,2000,1999,1998,1997,1996,1995,1994,1993,1992,1991,1990,1989,1988,1987,1986,1985,1984,1983,1982,1981,1980,1979,1978,1977,1976,1975,1974,1973,1972,1971,1970,1969,1968,1967,1966,1965,1964,1963,1962,1961
Queste statistiche in altri paesi:
AfghanistanAlbaniaAlgeriaAndorraAngolaAntigua and BarbudaArab WorldArgentinaArmeniaArubaAustraliaAustriaAzerbaijanBahamas, TheBahrainBangladeshBarbadosBelarusBelgiumBelizeBeninBermudaBhutanBoliviaBosnia and HerzegovinaBotswanaBrazilBritish Virgin IslandsBrunei DarussalamBulgariaBurkina FasoBurundiCabo VerdeCambodiaCameroonCanadaCaribbean small statesCayman IslandsCentral African RepublicCentral Europe and the BalticsChadChileChinaColombiaComorosCongo, Dem. Rep.Congo, Rep.Costa RicaCote d'IvoireCroatiaCubaCuracaoCyprusCzech RepublicDenmarkDjiboutiDominicaDominican RepublicEarly-demographic dividendEast Asia & PacificEast Asia & Pacific (excluding high income)East Asia & Pacific (IDA & IBRD countries)EcuadorEgypt, Arab Rep.El SalvadorEquatorial GuineaEritreaEstoniaEthiopiaEuro areaEurope & Central AsiaEurope & Central Asia (excluding high income)Europe & Central Asia (IDA & IBRD countries)European UnionFaroe IslandsFijiFinlandFragile and conflict affected situationsFranceFrench PolynesiaGabonGambia, TheGeorgiaGermanyGhanaGibraltarGreeceGreenlandGrenadaGuatemalaGuineaGuinea-BissauGuyanaHaitiHeavily indebted poor countries (HIPC)High incomeHondurasHong Kong SAR, ChinaHungaryIBRD onlyIcelandIDA & IBRD totalIDA blendIDA onlyIDA totalIndiaIndonesiaIran, Islamic Rep.IraqIrelandIsraelItalyJamaicaJapanJordanKazakhstanKenyaKiribatiKorea, Dem. People’s Rep.Korea, Rep.KuwaitKyrgyz RepublicLao PDRLate-demographic dividendLatin America & Caribbean Latin America & Caribbean (excluding high income)Latin America & the Caribbean (IDA & IBRD countries)LatviaLeast developed countries: UN classificationLebanonLesothoLiberiaLibyaLiechtensteinLithuaniaLow & middle incomeLow incomeLower middle incomeLuxembourgMacao SAR, ChinaMacedonia, FYRMadagascarMalawiMalaysiaMaldivesMaliMaltaMarshall IslandsMauritaniaMauritiusMexicoMicronesia, Fed. Sts.Middle East & North AfricaMiddle East & North Africa (excluding high income)Middle East & North Africa (IDA & IBRD countries)Middle incomeMoldovaMongoliaMontenegroMoroccoMozambiqueMyanmarNamibiaNauruNepalNetherlandsNew CaledoniaNew ZealandNicaraguaNigerNigeriaNorth AmericaNorwayOECD membersOmanOther small statesPacific island small statesPakistanPalauPanamaPapua New GuineaParaguayPeruPhilippinesPolandPortugalPost-demographic dividendPre-demographic dividendQatarRomaniaRussian FederationRwandaSamoaSao Tome and PrincipeSaudi ArabiaSenegalSerbiaSeychellesSierra LeoneSingaporeSint Maarten (Dutch part)Slovak RepublicSloveniaSmall statesSolomon IslandsSomaliaSouth AfricaSouth AsiaSouth Asia (IDA & IBRD)South SudanSpainSri LankaSt. Kitts and NevisSt. LuciaSt. Vincent and the GrenadinesSub-Saharan Africa Sub-Saharan Africa (excluding high income)Sub-Saharan Africa (IDA & IBRD countries)SudanSurinameSwazilandSwedenSwitzerlandSyrian Arab RepublicTajikistanTanzaniaThailandTimor-LesteTogoTongaTrinidad and TobagoTunisiaTurkeyTurkmenistanTurks and Caicos IslandsUgandaUkraineUnited Arab EmiratesUnited KingdomUnited StatesUpper middle incomeUruguayUzbekistanVanuatuVenezuela, RBVietnamWest Bank and GazaWorldYemen, Rep.ZambiaZimbabwe Linea del tempo:
Questa scala temporale mostra un grafico dal 1961 anno al 2014 anno. India. I dati fino ad 1960 anno non disponibili. Il numero di osservazioni attuali secondo i date: 54.
La fonte (nome):
Indicatori dello sviluppo mondiale
La fonte (organizzazione):
Carbon Dioxide Information Analysis Center, Environmental Sciences Division, Oak Ridge National Laboratory, Tennessee, United States.
Categorie:
Energy & Mining, Climate Change, Environment
sono stati aggiornati
23 apr 2017 anni
Indicatori delle variazioni dei valori per anni
Minima:
0.0
1 gen 1961 anni
Massimo:
5.833
1 gen 2011 anni
Alla data di osservazione
Valore
Variazione assoluta
La variazione rispetto al valore precedente
1 gen 1961 anni
0.0
0.0
0.0%
1 gen 1962 anni
0.003
+0.003
%
1 gen 1963 anni
0.008
+0.005
172.68%
1 gen 1964 anni
0.007
-0.001
-6.89%
1 gen 1965 anni
0.015
+0.007
104.56%
1 gen 1966 anni
0.17
+0.156
1.06 Mille.%
1 gen 1967 anni
0.181
+0.011
6.67%
1 gen 1968 anni
0.283
+0.102
56.04%
1 gen 1969 anni
0.401
+0.118
41.71%
1 gen 1970 anni
0.523
+0.122
30.33%
1 gen 1971 anni
0.474
-0.049
-9.45%
1 gen 1972 anni
0.527
+0.054
11.34%
1 gen 1973 anni
0.554
+0.027
5.04%
1 gen 1974 anni
0.521
-0.032
-5.85%
1 gen 1975 anni
0.586
+0.065
12.47%
1 gen 1976 anni
0.688
+0.101
17.28%
1 gen 1977 anni
0.87
+0.182
26.53%
1 gen 1978 anni
0.89
+0.019
2.23%
1 gen 1979 anni
0.969
+0.079
8.91%
1 gen 1980 anni
1.021
+0.053
5.42%
1 gen 1981 anni
0.793
-0.229
-22.37%
1 gen 1982 anni
0.852
+0.059
7.41%
1 gen 1983 anni
1.248
+0.396
46.54%
1 gen 1984 anni
1.386
+0.138
11.03%
1 gen 1985 anni
1.591
+0.205
14.81%
1 gen 1986 anni
1.689
+0.098
6.14%
1 gen 1987 anni
2.255
+0.566
33.54%
1 gen 1988 anni
2.618
+0.363
16.08%
1 gen 1989 anni
2.885
+0.267
10.2%
1 gen 1990 anni
3.201
+0.316
10.96%
1 gen 1991 anni
3.41
+0.209
6.54%
1 gen 1992 anni
3.583
+0.173
5.06%
1 gen 1993 anni
3.902
+0.319
8.91%
1 gen 1994 anni
3.733
-0.169
-4.32%
1 gen 1995 anni
3.795
+0.062
1.66%
1 gen 1996 anni
4.816
+1.02
26.89%
1 gen 1997 anni
4.509
-0.307
-6.38%
1 gen 1998 anni
5.019
+0.511
11.33%
1 gen 1999 anni
5.088
+0.069
1.37%
1 gen 2000 anni
4.253
-0.835
-16.41%
1 gen 2001 anni
4.255
+0.002
0.05%
1 gen 2002 anni
4.188
-0.067
-1.58%
1 gen 2003 anni
4.474
+0.286
6.84%
1 gen 2004 anni
4.55
+0.075
1.68%
1 gen 2005 anni
4.299
-0.251
-5.51%
1 gen 2006 anni
4.129
-0.17
-3.96%
1 gen 2007 anni
3.795
-0.334
-8.08%
1 gen 2008 anni
3.747
-0.049
-1.29%
1 gen 2009 anni
4.023
+0.276
7.38%
1 gen 2010 anni
5.248
+1.225
30.45%
1 gen 2011 anni
5.833
+0.585
11.15%
1 gen 2012 anni
4.952
-0.882
-15.12%
1 gen 2013 anni
3.872
-1.08
-21.81%
1 gen 2014 anni
5.007
+1.135
29.33%
Classificazione dei paesi secondo i statistiche attuali per anni


Commenti: