29
/it/
it
AIzaSyAYiBZKx7MnpbEhh9jyipgxe19OcubqV5w
April 1, 2024
44888
Low & middle income
LMY
false
2
1
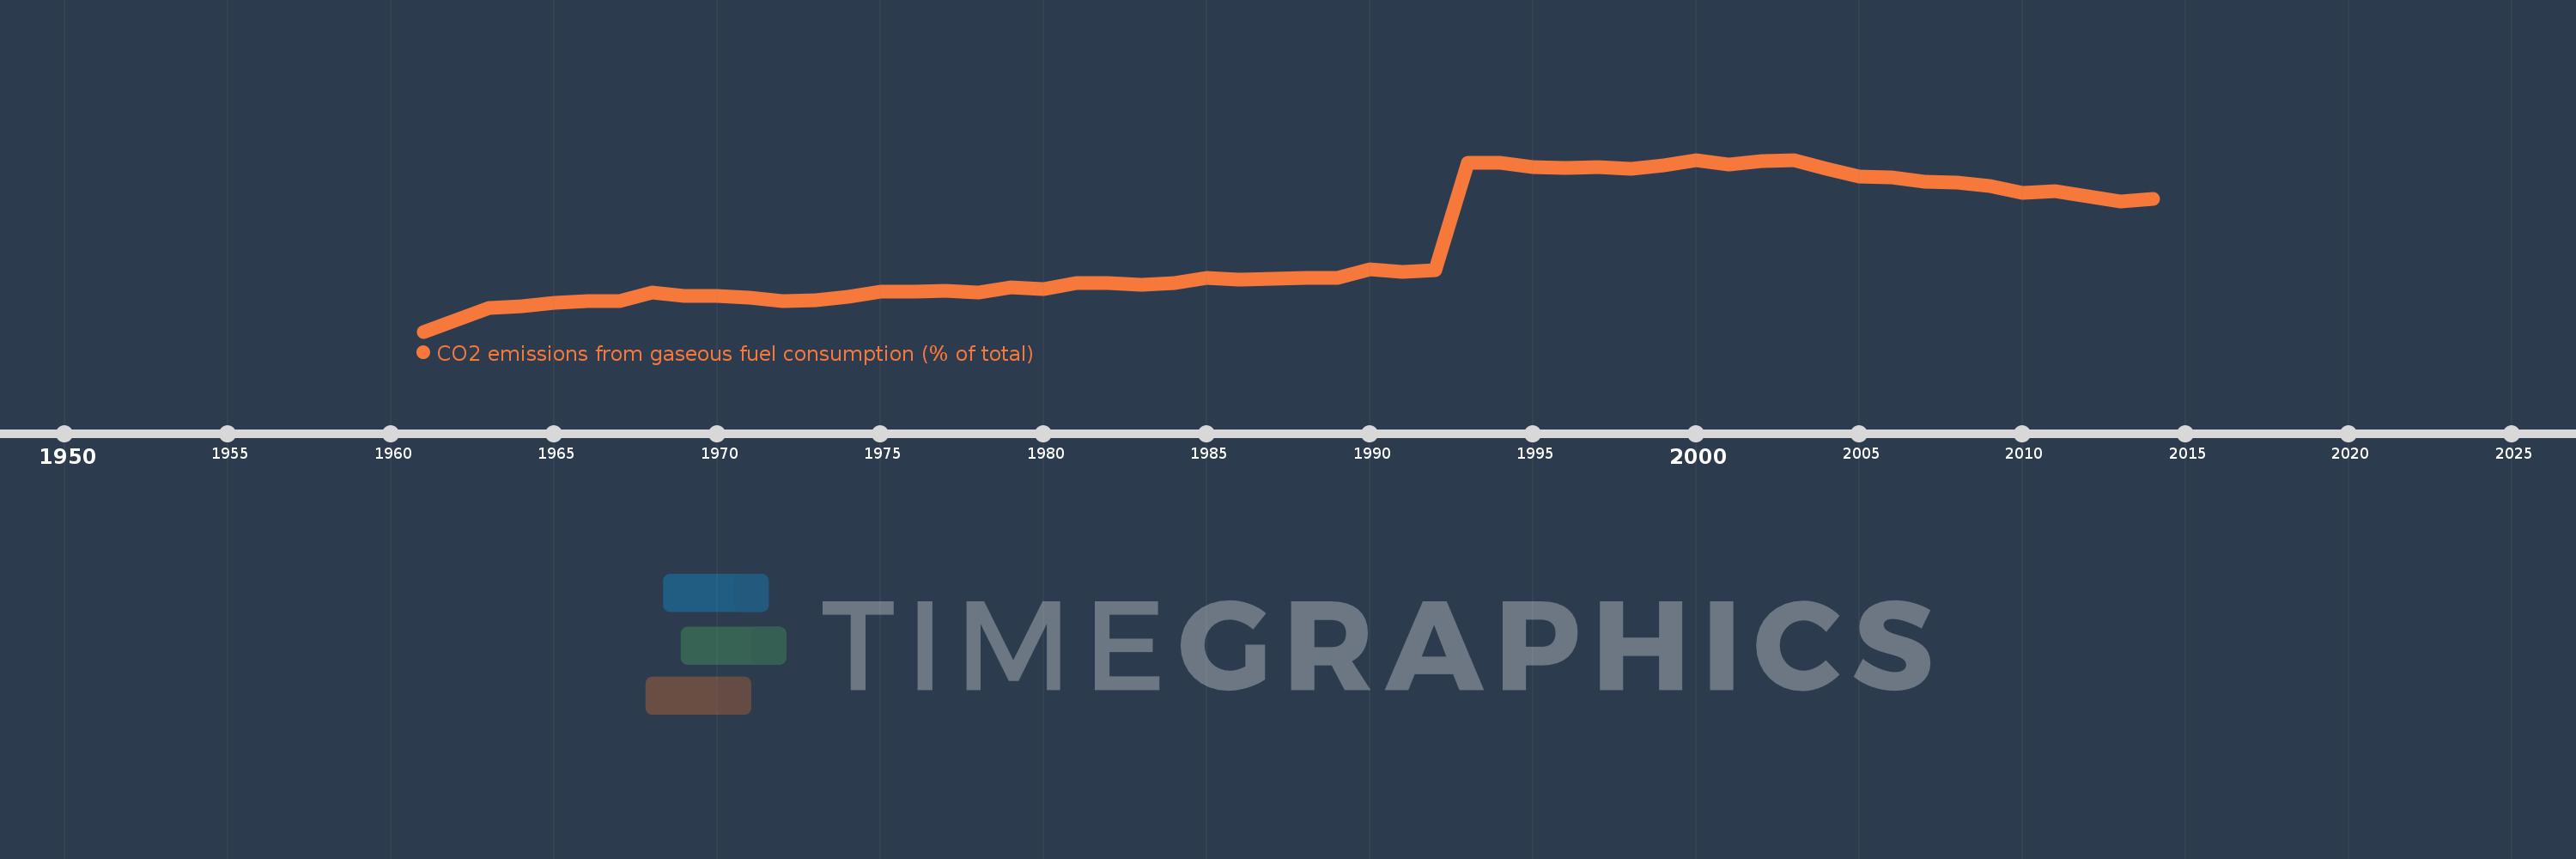
CO2 emissions from gaseous fuel consumption (% of total)
2014,2013,2012,2011,2010,2009,2008,2007,2006,2005,2004,2003,2002,2001,2000,1999,1998,1997,1996,1995,1994,1993,1992,1991,1990,1989,1988,1987,1986,1985,1984,1983,1982,1981,1980,1979,1978,1977,1976,1975,1974,1973,1972,1971,1970,1969,1968,1967,1966,1965,1964,1963,1962,1961
Queste statistiche in altri paesi:
AfghanistanAlbaniaAlgeriaAndorraAngolaAntigua and BarbudaArab WorldArgentinaArmeniaArubaAustraliaAustriaAzerbaijanBahamas, TheBahrainBangladeshBarbadosBelarusBelgiumBelizeBeninBermudaBhutanBoliviaBosnia and HerzegovinaBotswanaBrazilBritish Virgin IslandsBrunei DarussalamBulgariaBurkina FasoBurundiCabo VerdeCambodiaCameroonCanadaCaribbean small statesCayman IslandsCentral African RepublicCentral Europe and the BalticsChadChileChinaColombiaComorosCongo, Dem. Rep.Congo, Rep.Costa RicaCote d'IvoireCroatiaCubaCuracaoCyprusCzech RepublicDenmarkDjiboutiDominicaDominican RepublicEarly-demographic dividendEast Asia & PacificEast Asia & Pacific (excluding high income)East Asia & Pacific (IDA & IBRD countries)EcuadorEgypt, Arab Rep.El SalvadorEquatorial GuineaEritreaEstoniaEthiopiaEuro areaEurope & Central AsiaEurope & Central Asia (excluding high income)Europe & Central Asia (IDA & IBRD countries)European UnionFaroe IslandsFijiFinlandFragile and conflict affected situationsFranceFrench PolynesiaGabonGambia, TheGeorgiaGermanyGhanaGibraltarGreeceGreenlandGrenadaGuatemalaGuineaGuinea-BissauGuyanaHaitiHeavily indebted poor countries (HIPC)High incomeHondurasHong Kong SAR, ChinaHungaryIBRD onlyIcelandIDA & IBRD totalIDA blendIDA onlyIDA totalIndiaIndonesiaIran, Islamic Rep.IraqIrelandIsraelItalyJamaicaJapanJordanKazakhstanKenyaKiribatiKorea, Dem. People’s Rep.Korea, Rep.KuwaitKyrgyz RepublicLao PDRLate-demographic dividendLatin America & Caribbean Latin America & Caribbean (excluding high income)Latin America & the Caribbean (IDA & IBRD countries)LatviaLeast developed countries: UN classificationLebanonLesothoLiberiaLibyaLiechtensteinLithuaniaLow & middle incomeLow incomeLower middle incomeLuxembourgMacao SAR, ChinaMacedonia, FYRMadagascarMalawiMalaysiaMaldivesMaliMaltaMarshall IslandsMauritaniaMauritiusMexicoMicronesia, Fed. Sts.Middle East & North AfricaMiddle East & North Africa (excluding high income)Middle East & North Africa (IDA & IBRD countries)Middle incomeMoldovaMongoliaMontenegroMoroccoMozambiqueMyanmarNamibiaNauruNepalNetherlandsNew CaledoniaNew ZealandNicaraguaNigerNigeriaNorth AmericaNorwayOECD membersOmanOther small statesPacific island small statesPakistanPalauPanamaPapua New GuineaParaguayPeruPhilippinesPolandPortugalPost-demographic dividendPre-demographic dividendQatarRomaniaRussian FederationRwandaSamoaSao Tome and PrincipeSaudi ArabiaSenegalSerbiaSeychellesSierra LeoneSingaporeSint Maarten (Dutch part)Slovak RepublicSloveniaSmall statesSolomon IslandsSomaliaSouth AfricaSouth AsiaSouth Asia (IDA & IBRD)South SudanSpainSri LankaSt. Kitts and NevisSt. LuciaSt. Vincent and the GrenadinesSub-Saharan Africa Sub-Saharan Africa (excluding high income)Sub-Saharan Africa (IDA & IBRD countries)SudanSurinameSwazilandSwedenSwitzerlandSyrian Arab RepublicTajikistanTanzaniaThailandTimor-LesteTogoTongaTrinidad and TobagoTunisiaTurkeyTurkmenistanTurks and Caicos IslandsUgandaUkraineUnited Arab EmiratesUnited KingdomUnited StatesUpper middle incomeUruguayUzbekistanVanuatuVenezuela, RBVietnamWest Bank and GazaWorldYemen, Rep.ZambiaZimbabwe Linea del tempo:
Questa scala temporale mostra un grafico dal 1961 anno al 2014 anno. Low & middle income. I dati fino ad 1960 anno non disponibili. Il numero di osservazioni attuali secondo i date: 54.
La fonte (nome):
Indicatori dello sviluppo mondiale
La fonte (organizzazione):
Carbon Dioxide Information Analysis Center, Environmental Sciences Division, Oak Ridge National Laboratory, Tennessee, United States.
Categorie:
Energy & Mining, Climate Change, Environment
sono stati aggiornati
23 apr 2017 anni
Indicatori delle variazioni dei valori per anni
Minima:
3.288
1 gen 1961 anni
Massimo:
18.342
1 gen 2000 anni
Alla data di osservazione
Valore
Variazione assoluta
La variazione rispetto al valore precedente
1 gen 1961 anni
3.288
+3.288
0.0%
1 gen 1962 anni
4.335
+1.046
31.82%
1 gen 1963 anni
5.331
+0.997
22.99%
1 gen 1964 anni
5.537
+0.206
3.86%
1 gen 1965 anni
5.8
+0.263
4.75%
1 gen 1966 anni
5.982
+0.182
3.14%
1 gen 1967 anni
5.986
+0.004
0.07%
1 gen 1968 anni
6.694
+0.708
11.83%
1 gen 1969 anni
6.423
-0.271
-4.05%
1 gen 1970 anni
6.436
+0.013
0.21%
1 gen 1971 anni
6.25
-0.186
-2.89%
1 gen 1972 anni
5.97
-0.28
-4.48%
1 gen 1973 anni
6.054
+0.084
1.41%
1 gen 1974 anni
6.343
+0.288
4.76%
1 gen 1975 anni
6.774
+0.431
6.8%
1 gen 1976 anni
6.773
0.0
0.0%
1 gen 1977 anni
6.852
+0.079
1.17%
1 gen 1978 anni
6.745
-0.107
-1.57%
1 gen 1979 anni
7.195
+0.45
6.68%
1 gen 1980 anni
7.022
-0.173
-2.4%
1 gen 1981 anni
7.546
+0.524
7.46%
1 gen 1982 anni
7.543
-0.004
-0.05%
1 gen 1983 anni
7.395
-0.148
-1.96%
1 gen 1984 anni
7.535
+0.14
1.89%
1 gen 1985 anni
7.983
+0.448
5.95%
1 gen 1986 anni
7.831
-0.151
-1.9%
1 gen 1987 anni
7.88
+0.049
0.62%
1 gen 1988 anni
7.992
+0.111
1.41%
1 gen 1989 anni
8.011
+0.02
0.25%
1 gen 1990 anni
8.745
+0.734
9.16%
1 gen 1991 anni
8.54
-0.205
-2.35%
1 gen 1992 anni
8.635
+0.095
1.11%
1 gen 1993 anni
18.094
+9.459
109.55%
1 gen 1994 anni
18.062
-0.032
-0.18%
1 gen 1995 anni
17.686
-0.376
-2.08%
1 gen 1996 anni
17.645
-0.041
-0.23%
1 gen 1997 anni
17.724
+0.079
0.45%
1 gen 1998 anni
17.575
-0.149
-0.84%
1 gen 1999 anni
17.84
+0.265
1.51%
1 gen 2000 anni
18.342
+0.502
2.82%
1 gen 2001 anni
17.902
-0.441
-2.4%
1 gen 2002 anni
18.217
+0.315
1.76%
1 gen 2003 anni
18.338
+0.121
0.67%
1 gen 2004 anni
17.554
-0.784
-4.28%
1 gen 2005 anni
16.904
-0.65
-3.7%
1 gen 2006 anni
16.83
-0.073
-0.43%
1 gen 2007 anni
16.397
-0.433
-2.57%
1 gen 2008 anni
16.384
-0.014
-0.08%
1 gen 2009 anni
16.052
-0.332
-2.03%
1 gen 2010 anni
15.437
-0.614
-3.83%
1 gen 2011 anni
15.602
+0.165
1.07%
1 gen 2012 anni
15.109
-0.494
-3.16%
1 gen 2013 anni
14.691
-0.418
-2.76%
1 gen 2014 anni
14.883
+0.192
1.31%
Classificazione dei paesi secondo i statistiche attuali per anni


Commenti: