29
/it/
it
AIzaSyAYiBZKx7MnpbEhh9jyipgxe19OcubqV5w
April 1, 2024
135305
Gabon
GAB
true
2
1
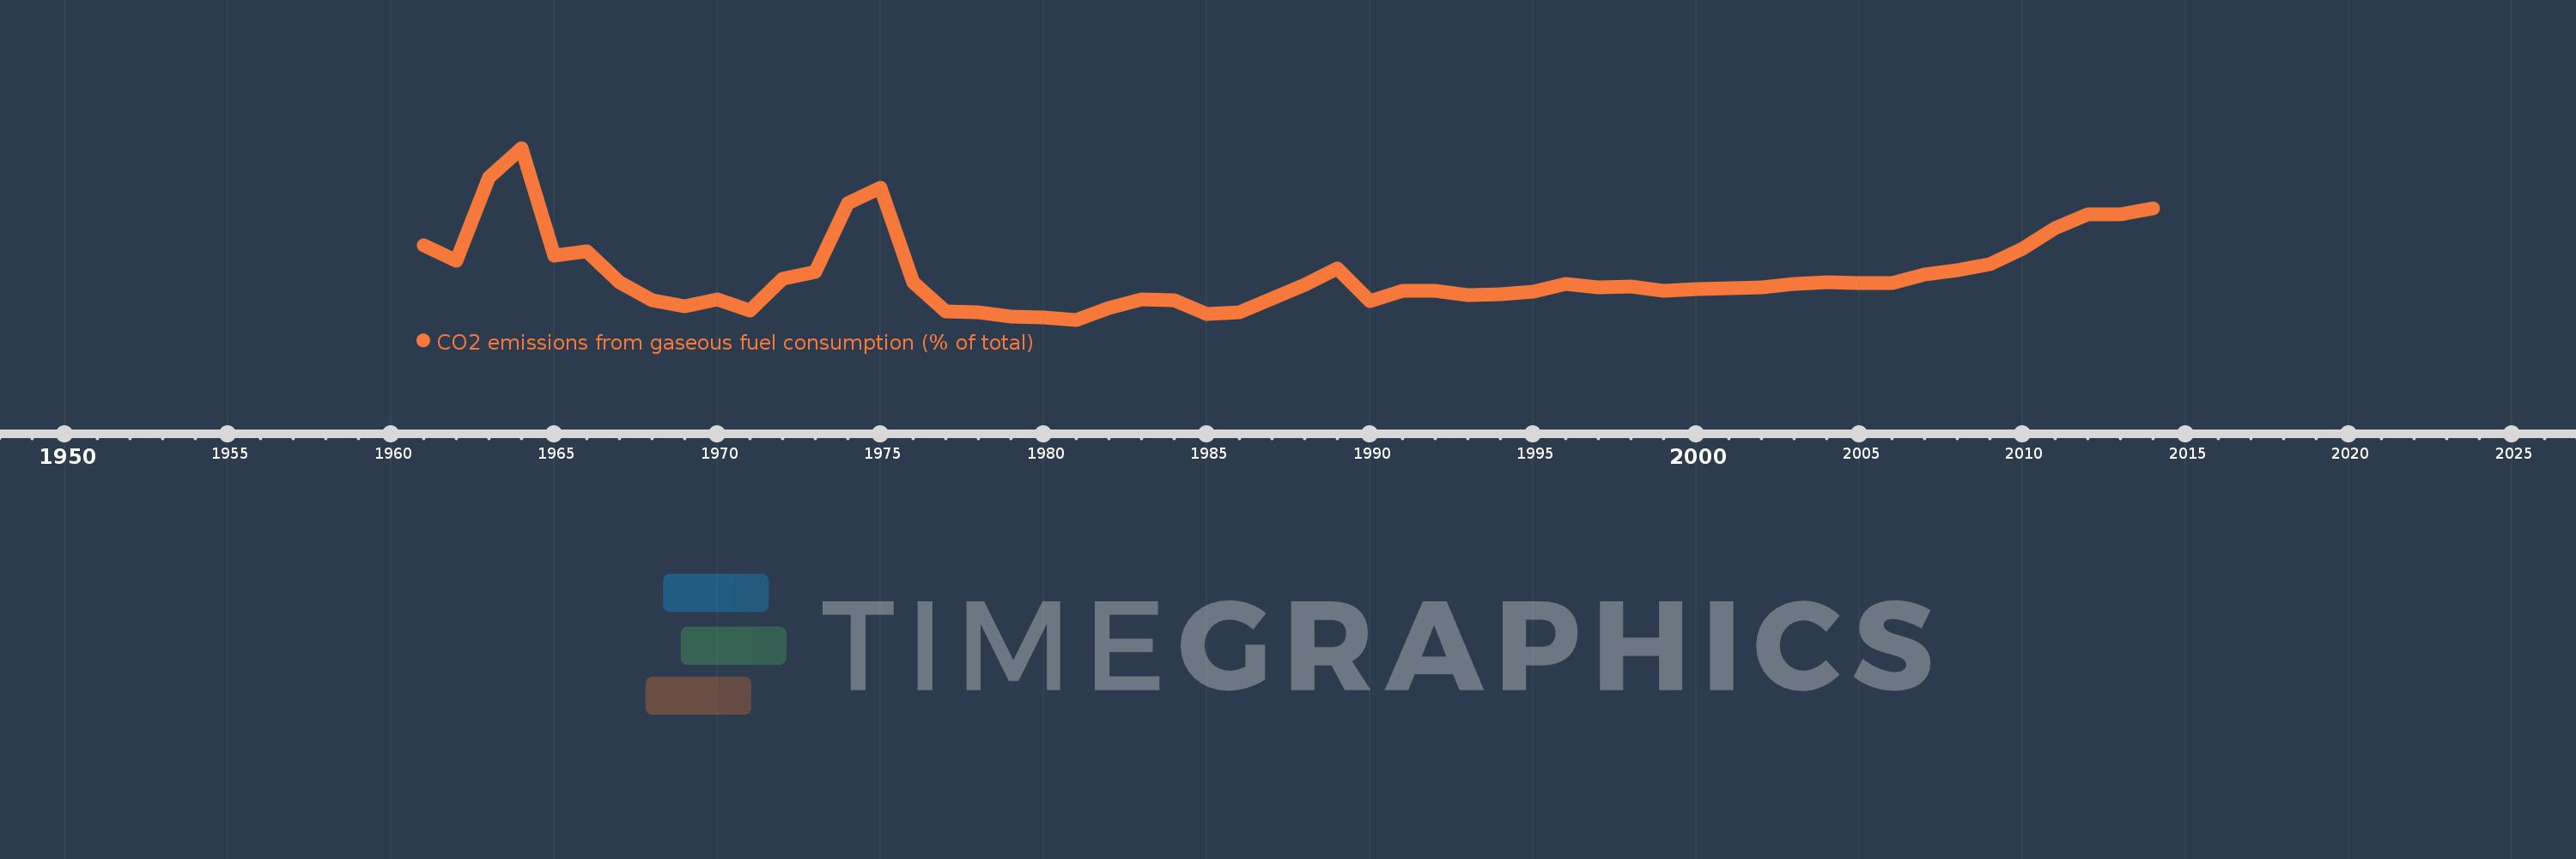
CO2 emissions from gaseous fuel consumption (% of total)
2014,2013,2012,2011,2010,2009,2008,2007,2006,2005,2004,2003,2002,2001,2000,1999,1998,1997,1996,1995,1994,1993,1992,1991,1990,1989,1988,1987,1986,1985,1984,1983,1982,1981,1980,1979,1978,1977,1976,1975,1974,1973,1972,1971,1970,1969,1968,1967,1966,1965,1964,1963,1962,1961
Queste statistiche in altri paesi:
AfghanistanAlbaniaAlgeriaAndorraAngolaAntigua and BarbudaArab WorldArgentinaArmeniaArubaAustraliaAustriaAzerbaijanBahamas, TheBahrainBangladeshBarbadosBelarusBelgiumBelizeBeninBermudaBhutanBoliviaBosnia and HerzegovinaBotswanaBrazilBritish Virgin IslandsBrunei DarussalamBulgariaBurkina FasoBurundiCabo VerdeCambodiaCameroonCanadaCaribbean small statesCayman IslandsCentral African RepublicCentral Europe and the BalticsChadChileChinaColombiaComorosCongo, Dem. Rep.Congo, Rep.Costa RicaCote d'IvoireCroatiaCubaCuracaoCyprusCzech RepublicDenmarkDjiboutiDominicaDominican RepublicEarly-demographic dividendEast Asia & PacificEast Asia & Pacific (excluding high income)East Asia & Pacific (IDA & IBRD countries)EcuadorEgypt, Arab Rep.El SalvadorEquatorial GuineaEritreaEstoniaEthiopiaEuro areaEurope & Central AsiaEurope & Central Asia (excluding high income)Europe & Central Asia (IDA & IBRD countries)European UnionFaroe IslandsFijiFinlandFragile and conflict affected situationsFranceFrench PolynesiaGabonGambia, TheGeorgiaGermanyGhanaGibraltarGreeceGreenlandGrenadaGuatemalaGuineaGuinea-BissauGuyanaHaitiHeavily indebted poor countries (HIPC)High incomeHondurasHong Kong SAR, ChinaHungaryIBRD onlyIcelandIDA & IBRD totalIDA blendIDA onlyIDA totalIndiaIndonesiaIran, Islamic Rep.IraqIrelandIsraelItalyJamaicaJapanJordanKazakhstanKenyaKiribatiKorea, Dem. People’s Rep.Korea, Rep.KuwaitKyrgyz RepublicLao PDRLate-demographic dividendLatin America & Caribbean Latin America & Caribbean (excluding high income)Latin America & the Caribbean (IDA & IBRD countries)LatviaLeast developed countries: UN classificationLebanonLesothoLiberiaLibyaLiechtensteinLithuaniaLow & middle incomeLow incomeLower middle incomeLuxembourgMacao SAR, ChinaMacedonia, FYRMadagascarMalawiMalaysiaMaldivesMaliMaltaMarshall IslandsMauritaniaMauritiusMexicoMicronesia, Fed. Sts.Middle East & North AfricaMiddle East & North Africa (excluding high income)Middle East & North Africa (IDA & IBRD countries)Middle incomeMoldovaMongoliaMontenegroMoroccoMozambiqueMyanmarNamibiaNauruNepalNetherlandsNew CaledoniaNew ZealandNicaraguaNigerNigeriaNorth AmericaNorwayOECD membersOmanOther small statesPacific island small statesPakistanPalauPanamaPapua New GuineaParaguayPeruPhilippinesPolandPortugalPost-demographic dividendPre-demographic dividendQatarRomaniaRussian FederationRwandaSamoaSao Tome and PrincipeSaudi ArabiaSenegalSerbiaSeychellesSierra LeoneSingaporeSint Maarten (Dutch part)Slovak RepublicSloveniaSmall statesSolomon IslandsSomaliaSouth AfricaSouth AsiaSouth Asia (IDA & IBRD)South SudanSpainSri LankaSt. Kitts and NevisSt. LuciaSt. Vincent and the GrenadinesSub-Saharan Africa Sub-Saharan Africa (excluding high income)Sub-Saharan Africa (IDA & IBRD countries)SudanSurinameSwazilandSwedenSwitzerlandSyrian Arab RepublicTajikistanTanzaniaThailandTimor-LesteTogoTongaTrinidad and TobagoTunisiaTurkeyTurkmenistanTurks and Caicos IslandsUgandaUkraineUnited Arab EmiratesUnited KingdomUnited StatesUpper middle incomeUruguayUzbekistanVanuatuVenezuela, RBVietnamWest Bank and GazaWorldYemen, Rep.ZambiaZimbabwe Linea del tempo:
Questa scala temporale mostra un grafico dal 1961 anno al 2014 anno. Gabon. I dati fino ad 1960 anno non disponibili. Il numero di osservazioni attuali secondo i date: 54.
La fonte (nome):
Indicatori dello sviluppo mondiale
La fonte (organizzazione):
Carbon Dioxide Information Analysis Center, Environmental Sciences Division, Oak Ridge National Laboratory, Tennessee, United States.
Categorie:
Energy & Mining, Climate Change, Environment
sono stati aggiornati
23 apr 2017 anni
Indicatori delle variazioni dei valori per anni
Minima:
0.442
1 gen 1981 anni
Massimo:
25.0
1 gen 1964 anni
Alla data di osservazione
Valore
Variazione assoluta
La variazione rispetto al valore precedente
1 gen 1961 anni
11.111
+11.111
0.0%
1 gen 1962 anni
8.889
-2.222
-20.0%
1 gen 1963 anni
20.833
+11.944
134.37%
1 gen 1964 anni
25.0
+4.167
20.0%
1 gen 1965 anni
9.615
-15.385
-61.54%
1 gen 1966 anni
10.169
+0.554
5.76%
1 gen 1967 anni
5.769
-4.4
-43.27%
1 gen 1968 anni
3.261
-2.508
-43.48%
1 gen 1969 anni
2.43
-0.831
-25.48%
1 gen 1970 anni
3.325
+0.895
36.83%
1 gen 1971 anni
1.761
-1.564
-47.05%
1 gen 1972 anni
6.314
+4.554
258.66%
1 gen 1973 anni
7.229
+0.914
14.48%
1 gen 1974 anni
17.115
+9.886
136.76%
1 gen 1975 anni
19.301
+2.185
12.77%
1 gen 1976 anni
5.806
-13.495
-69.92%
1 gen 1977 anni
1.67
-4.136
-71.24%
1 gen 1978 anni
1.568
-0.102
-6.1%
1 gen 1979 anni
0.921
-0.647
-41.23%
1 gen 1980 anni
0.814
-0.107
-11.62%
1 gen 1981 anni
0.442
-0.372
-45.69%
1 gen 1982 anni
2.064
+1.621
366.63%
1 gen 1983 anni
3.356
+1.292
62.62%
1 gen 1984 anni
3.256
-0.1
-2.98%
1 gen 1985 anni
1.284
-1.971
-60.55%
1 gen 1986 anni
1.509
+0.225
17.49%
1 gen 1987 anni
3.469
+1.96
129.86%
1 gen 1988 anni
5.469
+2.001
57.68%
1 gen 1989 anni
7.783
+2.314
42.31%
1 gen 1990 anni
3.05
-4.734
-60.82%
1 gen 1991 anni
4.564
+1.514
49.66%
1 gen 1992 anni
4.608
+0.044
0.96%
1 gen 1993 anni
4.015
-0.593
-12.87%
1 gen 1994 anni
4.115
+0.1
2.48%
1 gen 1995 anni
4.428
+0.313
7.61%
1 gen 1996 anni
5.551
+1.123
25.37%
1 gen 1997 anni
5.069
-0.482
-8.68%
1 gen 1998 anni
5.199
+0.13
2.56%
1 gen 1999 anni
4.639
-0.56
-10.76%
1 gen 2000 anni
4.805
+0.166
3.59%
1 gen 2001 anni
5.0
+0.195
4.05%
1 gen 2002 anni
5.118
+0.118
2.37%
1 gen 2003 anni
5.613
+0.495
9.67%
1 gen 2004 anni
5.845
+0.232
4.13%
1 gen 2005 anni
5.712
-0.133
-2.28%
1 gen 2006 anni
5.701
-0.011
-0.19%
1 gen 2007 anni
6.942
+1.241
21.76%
1 gen 2008 anni
7.569
+0.627
9.03%
1 gen 2009 anni
8.363
+0.794
10.49%
1 gen 2010 anni
10.584
+2.222
26.57%
1 gen 2011 anni
13.581
+2.997
28.32%
1 gen 2012 anni
15.505
+1.923
14.16%
1 gen 2013 anni
15.532
+0.028
0.18%
1 gen 2014 anni
16.423
+0.89
5.73%
Classificazione dei paesi secondo i statistiche attuali per anni


Commenti: