29
/it/
it
AIzaSyAYiBZKx7MnpbEhh9jyipgxe19OcubqV5w
April 1, 2024
56837
South Asia
SAS
false
2
1
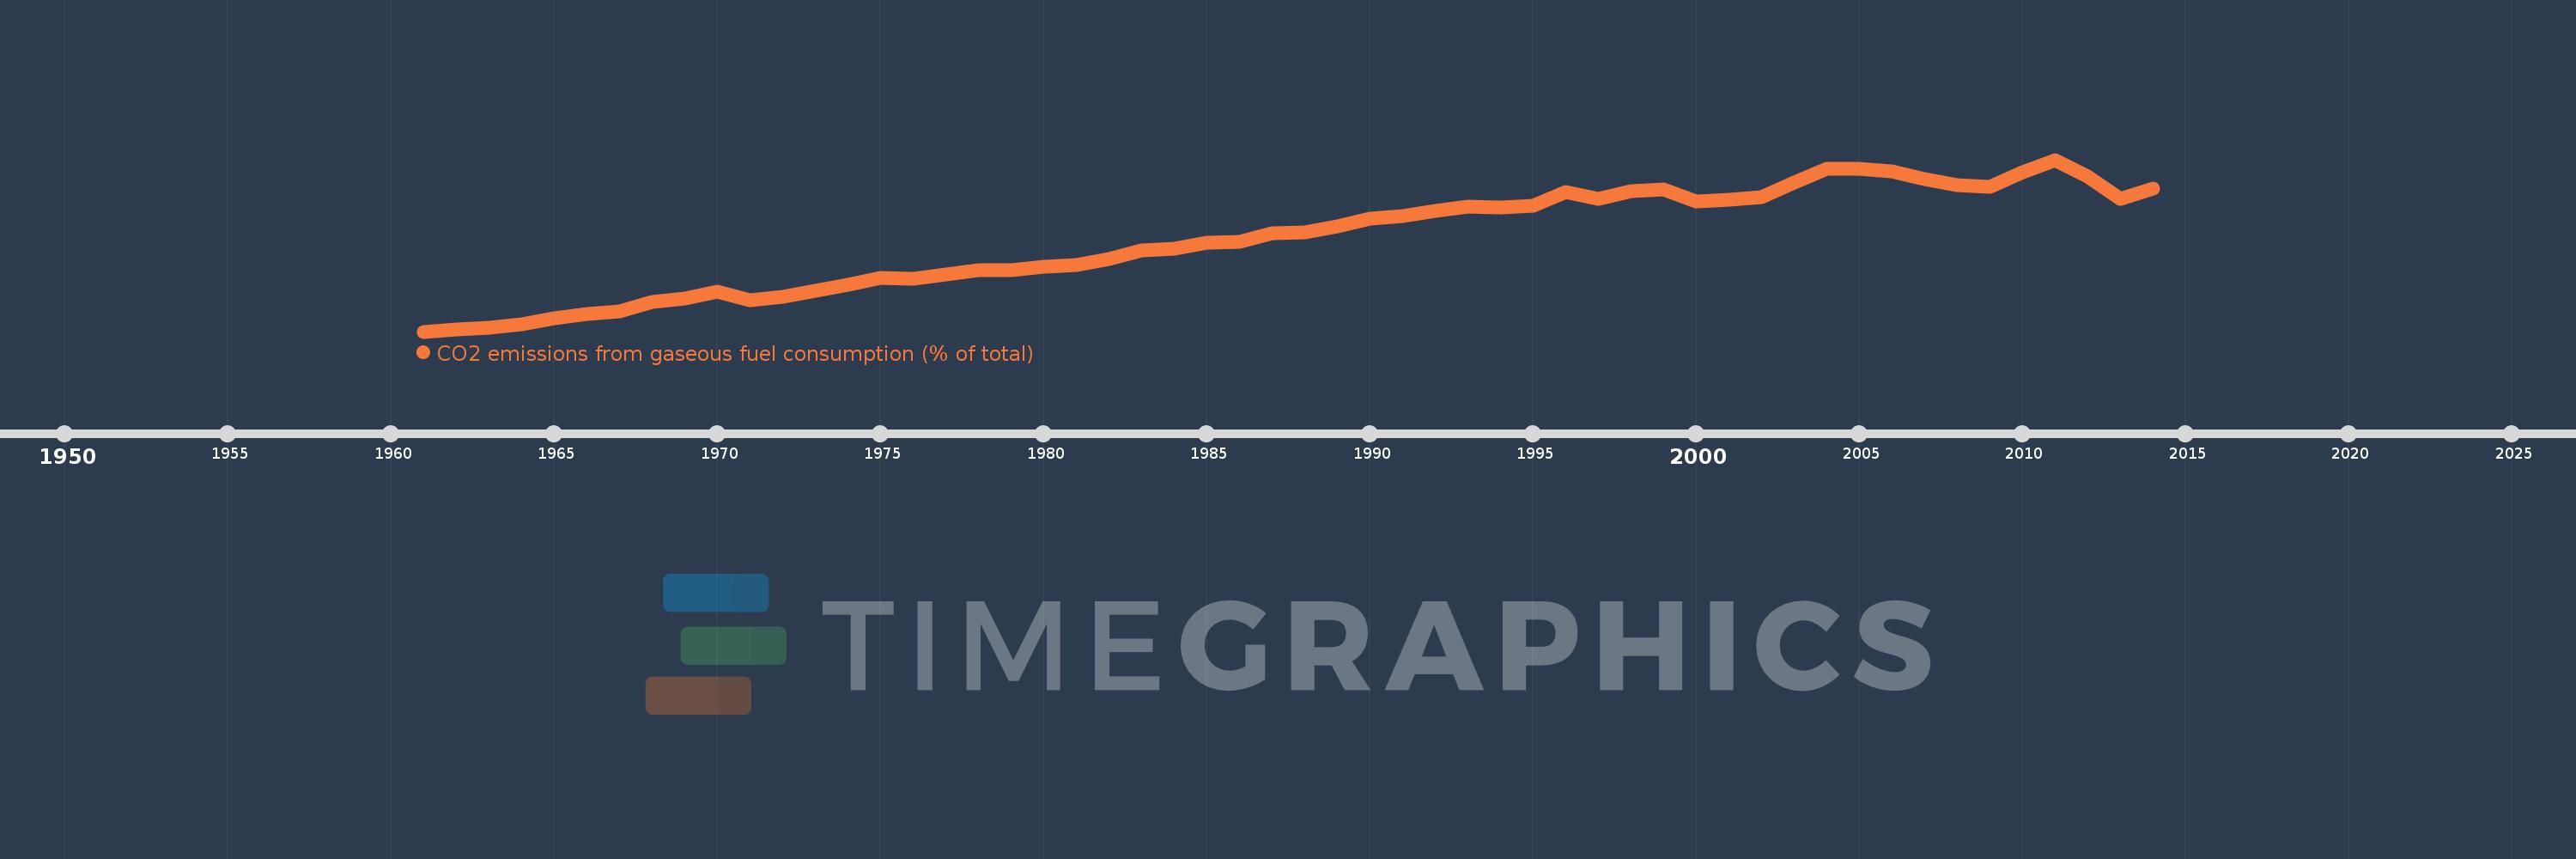
CO2 emissions from gaseous fuel consumption (% of total)
2014,2013,2012,2011,2010,2009,2008,2007,2006,2005,2004,2003,2002,2001,2000,1999,1998,1997,1996,1995,1994,1993,1992,1991,1990,1989,1988,1987,1986,1985,1984,1983,1982,1981,1980,1979,1978,1977,1976,1975,1974,1973,1972,1971,1970,1969,1968,1967,1966,1965,1964,1963,1962,1961
Queste statistiche in altri paesi:
AfghanistanAlbaniaAlgeriaAndorraAngolaAntigua and BarbudaArab WorldArgentinaArmeniaArubaAustraliaAustriaAzerbaijanBahamas, TheBahrainBangladeshBarbadosBelarusBelgiumBelizeBeninBermudaBhutanBoliviaBosnia and HerzegovinaBotswanaBrazilBritish Virgin IslandsBrunei DarussalamBulgariaBurkina FasoBurundiCabo VerdeCambodiaCameroonCanadaCaribbean small statesCayman IslandsCentral African RepublicCentral Europe and the BalticsChadChileChinaColombiaComorosCongo, Dem. Rep.Congo, Rep.Costa RicaCote d'IvoireCroatiaCubaCuracaoCyprusCzech RepublicDenmarkDjiboutiDominicaDominican RepublicEarly-demographic dividendEast Asia & PacificEast Asia & Pacific (excluding high income)East Asia & Pacific (IDA & IBRD countries)EcuadorEgypt, Arab Rep.El SalvadorEquatorial GuineaEritreaEstoniaEthiopiaEuro areaEurope & Central AsiaEurope & Central Asia (excluding high income)Europe & Central Asia (IDA & IBRD countries)European UnionFaroe IslandsFijiFinlandFragile and conflict affected situationsFranceFrench PolynesiaGabonGambia, TheGeorgiaGermanyGhanaGibraltarGreeceGreenlandGrenadaGuatemalaGuineaGuinea-BissauGuyanaHaitiHeavily indebted poor countries (HIPC)High incomeHondurasHong Kong SAR, ChinaHungaryIBRD onlyIcelandIDA & IBRD totalIDA blendIDA onlyIDA totalIndiaIndonesiaIran, Islamic Rep.IraqIrelandIsraelItalyJamaicaJapanJordanKazakhstanKenyaKiribatiKorea, Dem. People’s Rep.Korea, Rep.KuwaitKyrgyz RepublicLao PDRLate-demographic dividendLatin America & Caribbean Latin America & Caribbean (excluding high income)Latin America & the Caribbean (IDA & IBRD countries)LatviaLeast developed countries: UN classificationLebanonLesothoLiberiaLibyaLiechtensteinLithuaniaLow & middle incomeLow incomeLower middle incomeLuxembourgMacao SAR, ChinaMacedonia, FYRMadagascarMalawiMalaysiaMaldivesMaliMaltaMarshall IslandsMauritaniaMauritiusMexicoMicronesia, Fed. Sts.Middle East & North AfricaMiddle East & North Africa (excluding high income)Middle East & North Africa (IDA & IBRD countries)Middle incomeMoldovaMongoliaMontenegroMoroccoMozambiqueMyanmarNamibiaNauruNepalNetherlandsNew CaledoniaNew ZealandNicaraguaNigerNigeriaNorth AmericaNorwayOECD membersOmanOther small statesPacific island small statesPakistanPalauPanamaPapua New GuineaParaguayPeruPhilippinesPolandPortugalPost-demographic dividendPre-demographic dividendQatarRomaniaRussian FederationRwandaSamoaSao Tome and PrincipeSaudi ArabiaSenegalSerbiaSeychellesSierra LeoneSingaporeSint Maarten (Dutch part)Slovak RepublicSloveniaSmall statesSolomon IslandsSomaliaSouth AfricaSouth AsiaSouth Asia (IDA & IBRD)South SudanSpainSri LankaSt. Kitts and NevisSt. LuciaSt. Vincent and the GrenadinesSub-Saharan Africa Sub-Saharan Africa (excluding high income)Sub-Saharan Africa (IDA & IBRD countries)SudanSurinameSwazilandSwedenSwitzerlandSyrian Arab RepublicTajikistanTanzaniaThailandTimor-LesteTogoTongaTrinidad and TobagoTunisiaTurkeyTurkmenistanTurks and Caicos IslandsUgandaUkraineUnited Arab EmiratesUnited KingdomUnited StatesUpper middle incomeUruguayUzbekistanVanuatuVenezuela, RBVietnamWest Bank and GazaWorldYemen, Rep.ZambiaZimbabwe Linea del tempo:
Questa scala temporale mostra un grafico dal 1961 anno al 2014 anno. South Asia. I dati fino ad 1960 anno non disponibili. Il numero di osservazioni attuali secondo i date: 54.
La fonte (nome):
Indicatori dello sviluppo mondiale
La fonte (organizzazione):
Carbon Dioxide Information Analysis Center, Environmental Sciences Division, Oak Ridge National Laboratory, Tennessee, United States.
Categorie:
Energy & Mining, Climate Change, Environment
sono stati aggiornati
23 apr 2017 anni
Indicatori delle variazioni dei valori per anni
Minima:
0.824
1 gen 1961 anni
Massimo:
10.495
1 gen 2011 anni
Alla data di osservazione
Valore
Variazione assoluta
La variazione rispetto al valore precedente
1 gen 1961 anni
0.824
+0.824
0.0%
1 gen 1962 anni
0.932
+0.108
13.07%
1 gen 1963 anni
1.049
+0.117
12.57%
1 gen 1964 anni
1.215
+0.166
15.85%
1 gen 1965 anni
1.558
+0.343
28.25%
1 gen 1966 anni
1.816
+0.258
16.54%
1 gen 1967 anni
1.983
+0.167
9.17%
1 gen 1968 anni
2.48
+0.498
25.09%
1 gen 1969 anni
2.666
+0.185
7.48%
1 gen 1970 anni
3.068
+0.403
15.1%
1 gen 1971 anni
2.603
-0.465
-15.17%
1 gen 1972 anni
2.763
+0.16
6.15%
1 gen 1973 anni
3.108
+0.345
12.49%
1 gen 1974 anni
3.466
+0.357
11.5%
1 gen 1975 anni
3.856
+0.39
11.25%
1 gen 1976 anni
3.774
-0.082
-2.12%
1 gen 1977 anni
4.036
+0.262
6.95%
1 gen 1978 anni
4.271
+0.235
5.82%
1 gen 1979 anni
4.299
+0.028
0.66%
1 gen 1980 anni
4.458
+0.159
3.69%
1 gen 1981 anni
4.573
+0.115
2.58%
1 gen 1982 anni
4.911
+0.338
7.39%
1 gen 1983 anni
5.408
+0.498
10.14%
1 gen 1984 anni
5.509
+0.101
1.86%
1 gen 1985 anni
5.851
+0.342
6.2%
1 gen 1986 anni
5.885
+0.034
0.58%
1 gen 1987 anni
6.368
+0.483
8.21%
1 gen 1988 anni
6.388
+0.021
0.32%
1 gen 1989 anni
6.743
+0.355
5.56%
1 gen 1990 anni
7.174
+0.431
6.39%
1 gen 1991 anni
7.351
+0.177
2.46%
1 gen 1992 anni
7.602
+0.252
3.43%
1 gen 1993 anni
7.869
+0.267
3.51%
1 gen 1994 anni
7.825
-0.044
-0.56%
1 gen 1995 anni
7.91
+0.085
1.08%
1 gen 1996 anni
8.678
+0.768
9.71%
1 gen 1997 anni
8.302
-0.376
-4.33%
1 gen 1998 anni
8.751
+0.449
5.41%
1 gen 1999 anni
8.847
+0.096
1.09%
1 gen 2000 anni
8.171
-0.677
-7.65%
1 gen 2001 anni
8.249
+0.078
0.96%
1 gen 2002 anni
8.405
+0.157
1.9%
1 gen 2003 anni
9.234
+0.828
9.85%
1 gen 2004 anni
9.989
+0.755
8.18%
1 gen 2005 anni
9.98
-0.009
-0.09%
1 gen 2006 anni
9.822
-0.158
-1.58%
1 gen 2007 anni
9.393
-0.429
-4.37%
1 gen 2008 anni
9.062
-0.331
-3.52%
1 gen 2009 anni
8.979
-0.083
-0.92%
1 gen 2010 anni
9.815
+0.836
9.31%
1 gen 2011 anni
10.495
+0.68
6.93%
1 gen 2012 anni
9.545
-0.95
-9.05%
1 gen 2013 anni
8.293
-1.252
-13.12%
1 gen 2014 anni
8.885
+0.593
7.14%
Classificazione dei paesi secondo i statistiche attuali per anni


Commenti: