29
/it/
it
AIzaSyAYiBZKx7MnpbEhh9jyipgxe19OcubqV5w
April 1, 2024
78521
Bangladesh
BGD
true
2
1
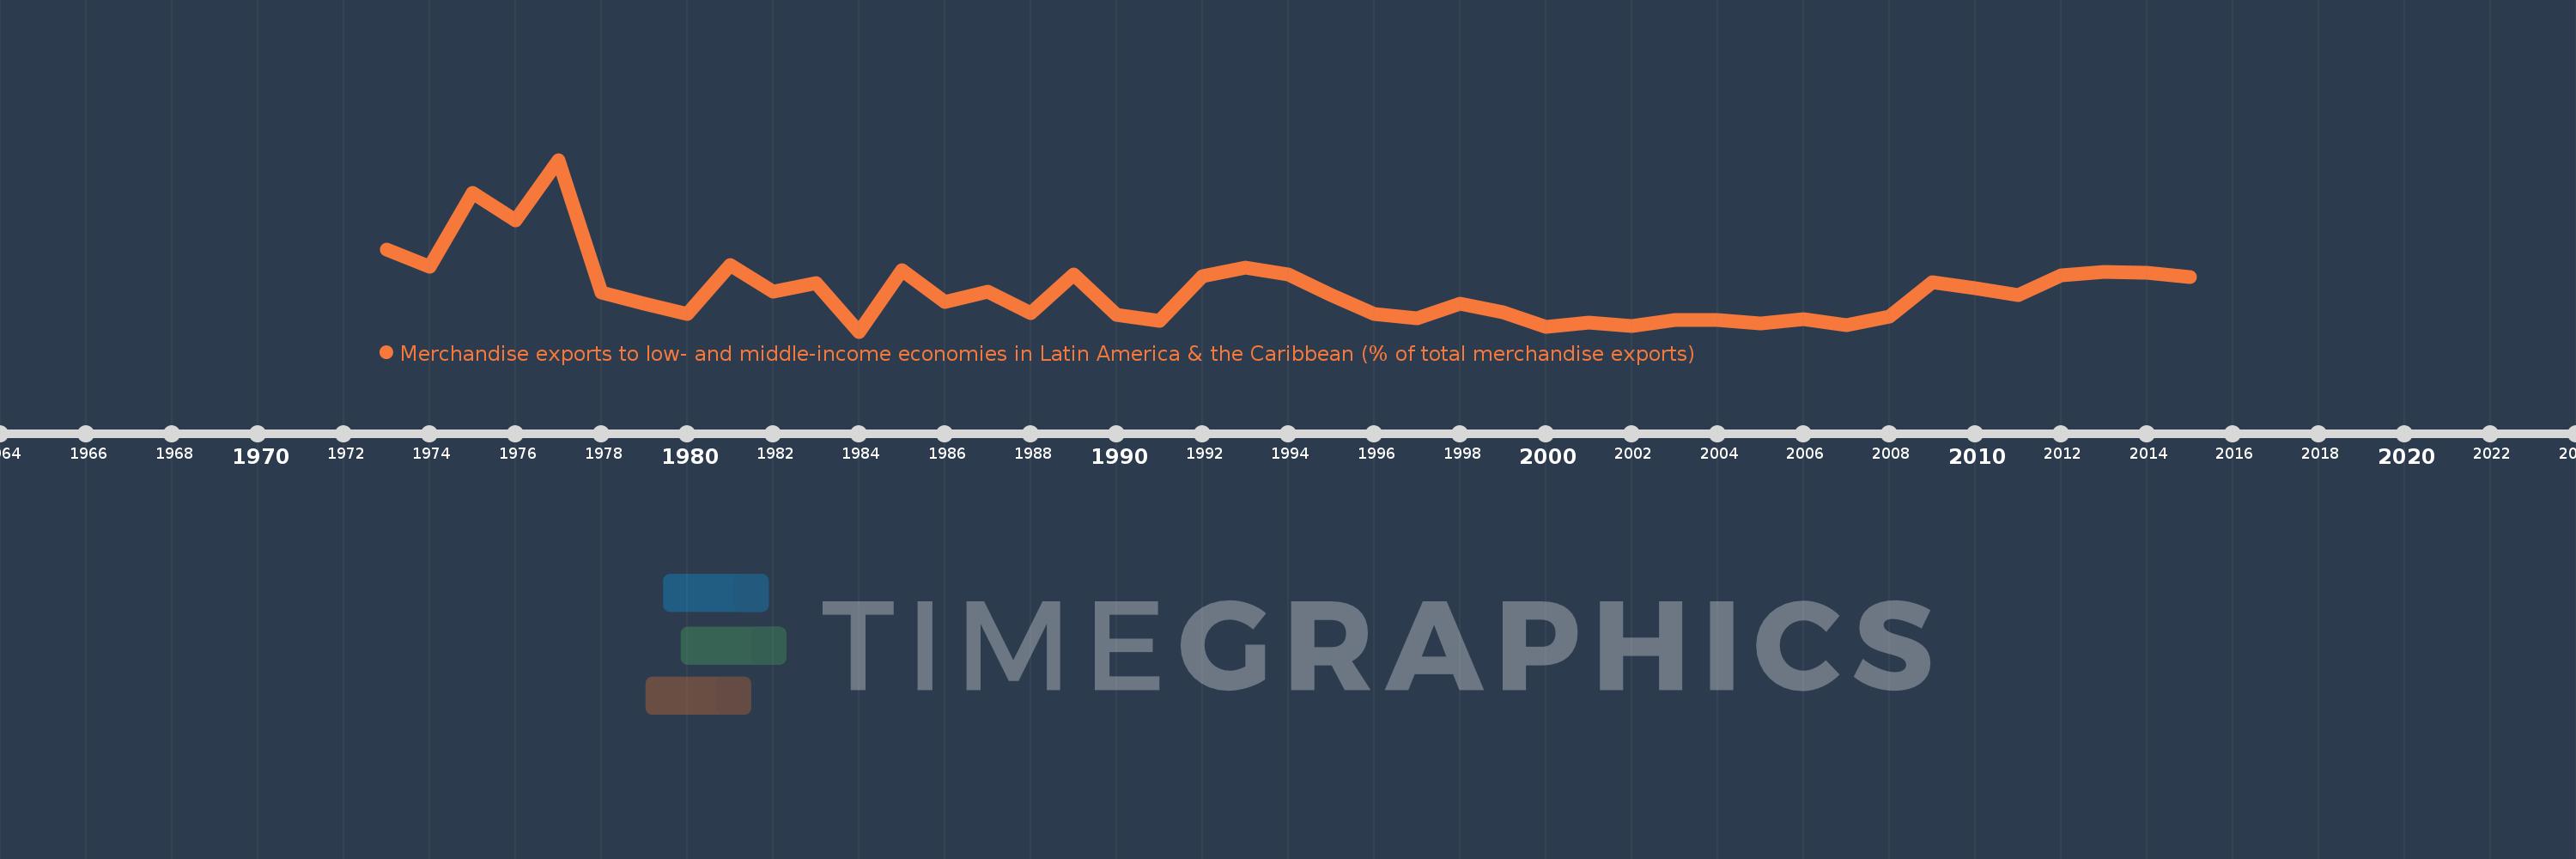
Merchandise exports to low- and middle-income economies in Latin America & the Caribbean (% of total merchandise exports)
2015,2014,2013,2012,2011,2010,2009,2008,2007,2006,2005,2004,2003,2002,2001,2000,1999,1998,1997,1996,1995,1994,1993,1992,1991,1990,1989,1988,1987,1986,1985,1984,1983,1982,1981,1980,1979,1978,1977,1976,1975,1974,1973
Queste statistiche in altri paesi:
AfghanistanAlbaniaAlgeriaAngolaAntigua and BarbudaArab WorldArgentinaArmeniaArubaAustraliaAustriaAzerbaijanBahamas, TheBahrainBangladeshBarbadosBelarusBelgiumBelizeBeninBermudaBoliviaBrazilBrunei DarussalamBulgariaBurundiCabo VerdeCambodiaCameroonCanadaCaribbean small statesCentral African RepublicCentral Europe and the BalticsChileChinaColombiaCongo, Dem. Rep.Congo, Rep.Costa RicaCote d'IvoireCroatiaCubaCyprusCzech RepublicDenmarkDominicaDominican RepublicEarly-demographic dividendEast Asia & PacificEast Asia & Pacific (excluding high income)East Asia & Pacific (IDA & IBRD countries)EcuadorEgypt, Arab Rep.El SalvadorEstoniaEthiopiaEuro areaEurope & Central AsiaEurope & Central Asia (excluding high income)Europe & Central Asia (IDA & IBRD countries)European UnionFaroe IslandsFijiFinlandFragile and conflict affected situationsFranceFrench PolynesiaGabonGambia, TheGeorgiaGermanyGhanaGibraltarGreeceGreenlandGrenadaGuatemalaGuineaGuyanaHaitiHeavily indebted poor countries (HIPC)High incomeHondurasHong Kong SAR, ChinaHungaryIBRD onlyIcelandIDA & IBRD totalIDA blendIDA onlyIDA totalIndiaIndonesiaIran, Islamic Rep.IraqIrelandIsraelItalyJamaicaJapanJordanKazakhstanKenyaKorea, Dem. People’s Rep.Korea, Rep.KuwaitLao PDRLate-demographic dividendLatin America & Caribbean Latin America & Caribbean (excluding high income)Latin America & the Caribbean (IDA & IBRD countries)LatviaLeast developed countries: UN classificationLebanonLiberiaLibyaLithuaniaLow & middle incomeLow incomeLower middle incomeLuxembourgMacao SAR, ChinaMacedonia, FYRMadagascarMalawiMalaysiaMaliMaltaMauritaniaMauritiusMexicoMiddle East & North AfricaMiddle East & North Africa (excluding high income)Middle East & North Africa (IDA & IBRD countries)Middle incomeMongoliaMontenegroMoroccoMozambiqueMyanmarNetherlandsNew CaledoniaNew ZealandNicaraguaNigerNigeriaNorth AmericaNorwayOECD membersOmanOther small statesPacific island small statesPakistanPanamaPapua New GuineaParaguayPeruPhilippinesPolandPortugalPost-demographic dividendPre-demographic dividendQatarRomaniaRussian FederationRwandaSamoaSaudi ArabiaSenegalSerbiaSierra LeoneSingaporeSlovak RepublicSloveniaSmall statesSomaliaSouth AfricaSouth AsiaSouth Asia (IDA & IBRD)SpainSri LankaSt. Kitts and NevisSt. LuciaSt. Vincent and the GrenadinesSub-Saharan Africa Sub-Saharan Africa (excluding high income)Sub-Saharan Africa (IDA & IBRD countries)SudanSurinameSwedenSwitzerlandSyrian Arab RepublicTanzaniaThailandTogoTrinidad and TobagoTunisiaTurkeyUgandaUkraineUnited Arab EmiratesUnited KingdomUnited StatesUpper middle incomeUruguayVenezuela, RBVietnamWorldYemen, Rep.ZambiaZimbabwe Linea del tempo:
Questa scala temporale mostra un grafico dal 1973 anno al 2015 anno. Bangladesh. I dati fino ad 1972 anno non disponibili. Il numero di osservazioni attuali secondo i date: 43.
La fonte (nome):
Indicatori dello sviluppo mondiale
La fonte (organizzazione):
World Bank staff estimates based data from International Monetary Fund's Direction of Trade database.
Categorie:
Private Sector, Trade
sono stati aggiornati
23 apr 2017 anni
Indicatori delle variazioni dei valori per anni
Minima:
0.215
1 gen 1984 anni
Massimo:
2.67
1 gen 1977 anni
Alla data di osservazione
Valore
Variazione assoluta
La variazione rispetto al valore precedente
1 gen 1973 anni
1.391
+1.391
0.0%
1 gen 1974 anni
1.145
-0.245
-17.65%
1 gen 1975 anni
2.197
+1.052
91.8%
1 gen 1976 anni
1.81
-0.387
-17.62%
1 gen 1977 anni
2.67
+0.86
47.51%
1 gen 1978 anni
0.772
-1.898
-71.08%
1 gen 1979 anni
0.608
-0.164
-21.26%
1 gen 1980 anni
0.462
-0.146
-24.03%
1 gen 1981 anni
1.162
+0.7
151.55%
1 gen 1982 anni
0.789
-0.373
-32.13%
1 gen 1983 anni
0.905
+0.116
14.76%
1 gen 1984 anni
0.215
-0.69
-76.2%
1 gen 1985 anni
1.097
+0.882
409.55%
1 gen 1986 anni
0.642
-0.456
-41.52%
1 gen 1987 anni
0.783
+0.141
22.01%
1 gen 1988 anni
0.48
-0.303
-38.68%
1 gen 1989 anni
1.036
+0.556
115.84%
1 gen 1990 anni
0.46
-0.576
-55.6%
1 gen 1991 anni
0.367
-0.093
-20.21%
1 gen 1992 anni
1.002
+0.635
172.82%
1 gen 1993 anni
1.134
+0.132
13.19%
1 gen 1994 anni
1.037
-0.097
-8.57%
1 gen 1995 anni
0.741
-0.296
-28.56%
1 gen 1996 anni
0.463
-0.278
-37.53%
1 gen 1997 anni
0.406
-0.057
-12.25%
1 gen 1998 anni
0.612
+0.206
50.81%
1 gen 1999 anni
0.492
-0.12
-19.56%
1 gen 2000 anni
0.281
-0.212
-43.03%
1 gen 2001 anni
0.339
+0.058
20.73%
1 gen 2002 anni
0.289
-0.05
-14.65%
1 gen 2003 anni
0.378
+0.089
30.67%
1 gen 2004 anni
0.38
+0.002
0.53%
1 gen 2005 anni
0.326
-0.054
-14.28%
1 gen 2006 anni
0.394
+0.069
21.15%
1 gen 2007 anni
0.306
-0.088
-22.4%
1 gen 2008 anni
0.43
+0.124
40.57%
1 gen 2009 anni
0.916
+0.486
112.94%
1 gen 2010 anni
0.833
-0.084
-9.12%
1 gen 2011 anni
0.739
-0.093
-11.18%
1 gen 2012 anni
1.015
+0.275
37.24%
1 gen 2013 anni
1.063
+0.048
4.77%
1 gen 2014 anni
1.061
-0.002
-0.22%
1 gen 2015 anni
0.994
-0.066
-6.26%
Classificazione dei paesi secondo i statistiche attuali per anni


Commenti: