29
/it/
it
AIzaSyAYiBZKx7MnpbEhh9jyipgxe19OcubqV5w
April 1, 2024
44430
Least developed countries: UN classification
LDC
false
2
1
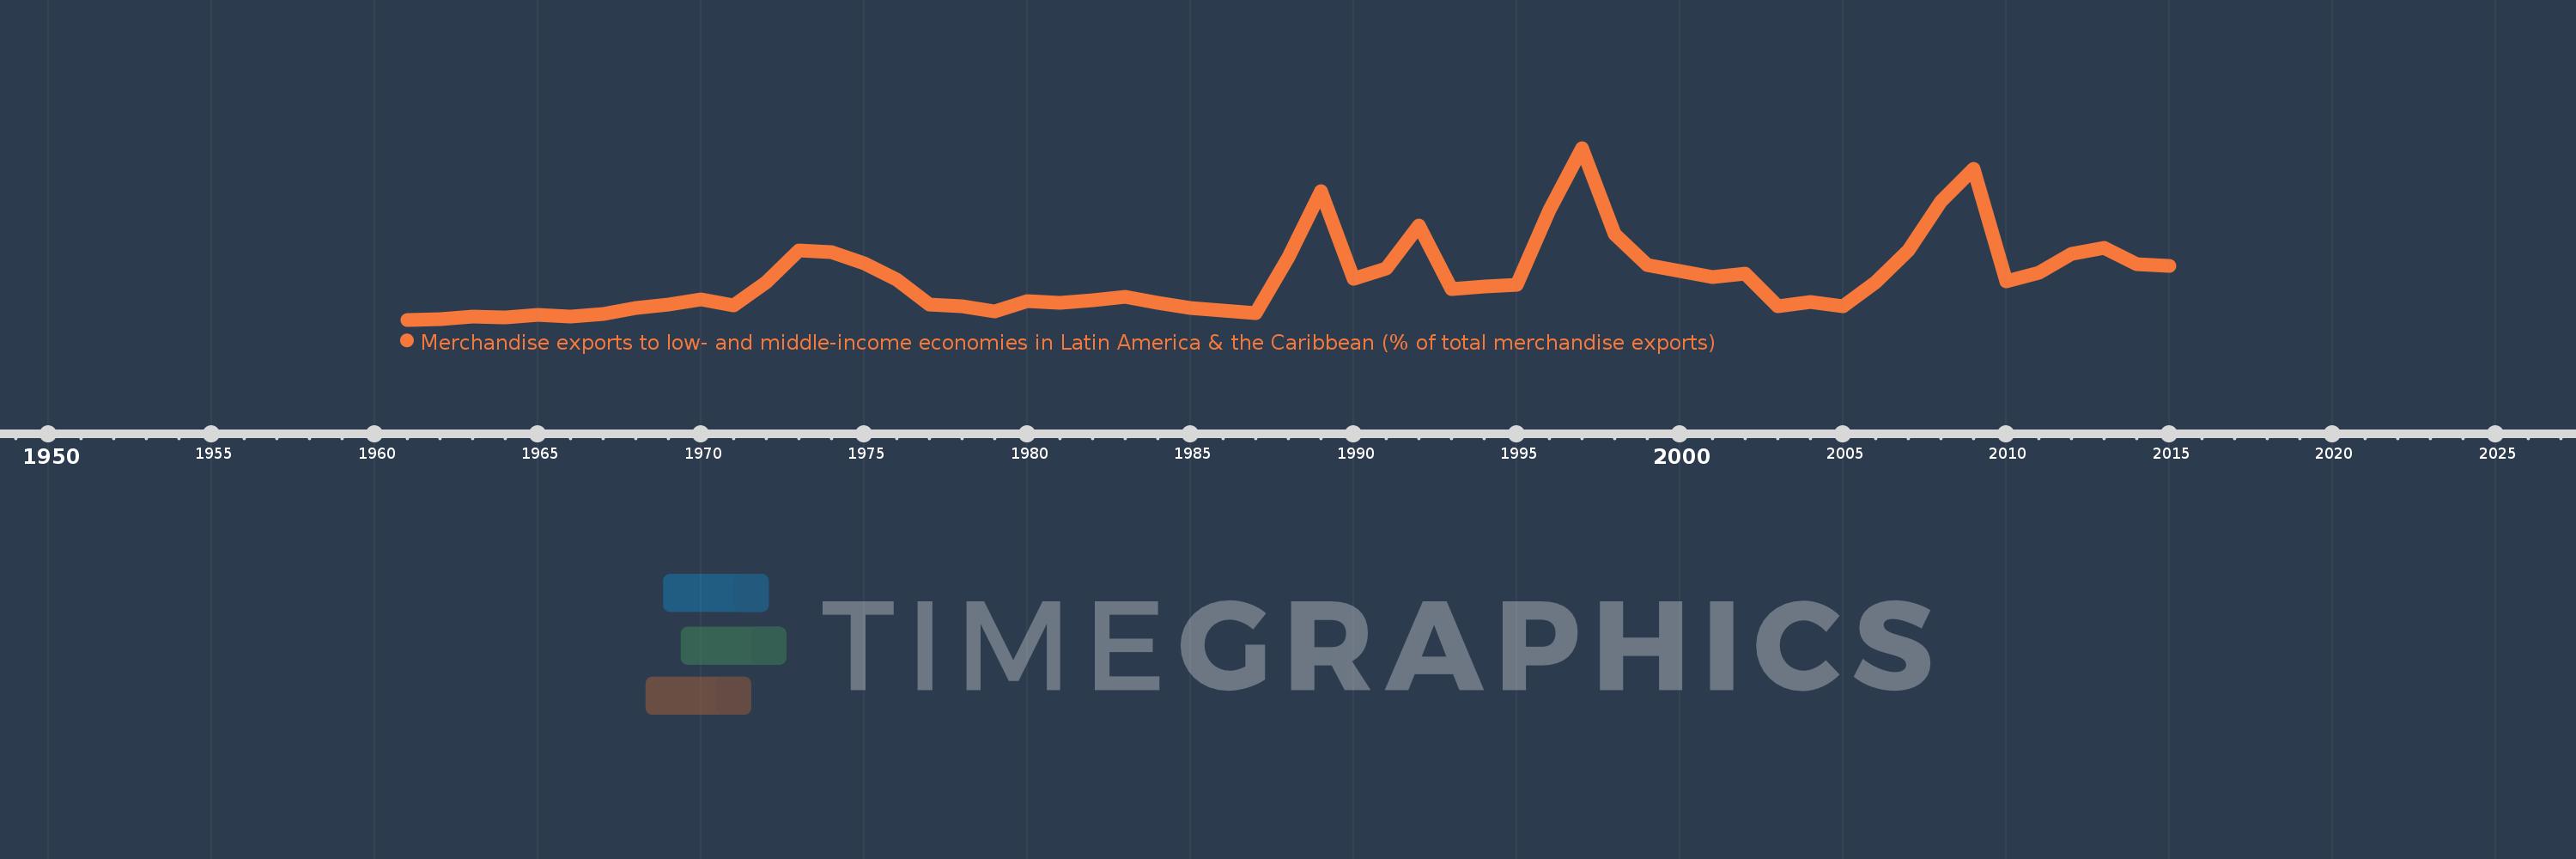
Merchandise exports to low- and middle-income economies in Latin America & the Caribbean (% of total merchandise exports)
2015,2014,2013,2012,2011,2010,2009,2008,2007,2006,2005,2004,2003,2002,2001,2000,1999,1998,1997,1996,1995,1994,1993,1992,1991,1990,1989,1988,1987,1986,1985,1984,1983,1982,1981,1980,1979,1978,1977,1976,1975,1974,1973,1972,1971,1970,1969,1968,1967,1966,1965,1964,1963,1962,1961
Queste statistiche in altri paesi:
AfghanistanAlbaniaAlgeriaAngolaAntigua and BarbudaArab WorldArgentinaArmeniaArubaAustraliaAustriaAzerbaijanBahamas, TheBahrainBangladeshBarbadosBelarusBelgiumBelizeBeninBermudaBoliviaBrazilBrunei DarussalamBulgariaBurundiCabo VerdeCambodiaCameroonCanadaCaribbean small statesCentral African RepublicCentral Europe and the BalticsChileChinaColombiaCongo, Dem. Rep.Congo, Rep.Costa RicaCote d'IvoireCroatiaCubaCyprusCzech RepublicDenmarkDominicaDominican RepublicEarly-demographic dividendEast Asia & PacificEast Asia & Pacific (excluding high income)East Asia & Pacific (IDA & IBRD countries)EcuadorEgypt, Arab Rep.El SalvadorEstoniaEthiopiaEuro areaEurope & Central AsiaEurope & Central Asia (excluding high income)Europe & Central Asia (IDA & IBRD countries)European UnionFaroe IslandsFijiFinlandFragile and conflict affected situationsFranceFrench PolynesiaGabonGambia, TheGeorgiaGermanyGhanaGibraltarGreeceGreenlandGrenadaGuatemalaGuineaGuyanaHaitiHeavily indebted poor countries (HIPC)High incomeHondurasHong Kong SAR, ChinaHungaryIBRD onlyIcelandIDA & IBRD totalIDA blendIDA onlyIDA totalIndiaIndonesiaIran, Islamic Rep.IraqIrelandIsraelItalyJamaicaJapanJordanKazakhstanKenyaKorea, Dem. People’s Rep.Korea, Rep.KuwaitLao PDRLate-demographic dividendLatin America & Caribbean Latin America & Caribbean (excluding high income)Latin America & the Caribbean (IDA & IBRD countries)LatviaLeast developed countries: UN classificationLebanonLiberiaLibyaLithuaniaLow & middle incomeLow incomeLower middle incomeLuxembourgMacao SAR, ChinaMacedonia, FYRMadagascarMalawiMalaysiaMaliMaltaMauritaniaMauritiusMexicoMiddle East & North AfricaMiddle East & North Africa (excluding high income)Middle East & North Africa (IDA & IBRD countries)Middle incomeMongoliaMontenegroMoroccoMozambiqueMyanmarNetherlandsNew CaledoniaNew ZealandNicaraguaNigerNigeriaNorth AmericaNorwayOECD membersOmanOther small statesPacific island small statesPakistanPanamaPapua New GuineaParaguayPeruPhilippinesPolandPortugalPost-demographic dividendPre-demographic dividendQatarRomaniaRussian FederationRwandaSamoaSaudi ArabiaSenegalSerbiaSierra LeoneSingaporeSlovak RepublicSloveniaSmall statesSomaliaSouth AfricaSouth AsiaSouth Asia (IDA & IBRD)SpainSri LankaSt. Kitts and NevisSt. LuciaSt. Vincent and the GrenadinesSub-Saharan Africa Sub-Saharan Africa (excluding high income)Sub-Saharan Africa (IDA & IBRD countries)SudanSurinameSwedenSwitzerlandSyrian Arab RepublicTanzaniaThailandTogoTrinidad and TobagoTunisiaTurkeyUgandaUkraineUnited Arab EmiratesUnited KingdomUnited StatesUpper middle incomeUruguayVenezuela, RBVietnamWorldYemen, Rep.ZambiaZimbabwe Linea del tempo:
Questa scala temporale mostra un grafico dal 1961 anno al 2015 anno. Least developed countries: UN classification. I dati fino ad 1960 anno non disponibili. Il numero di osservazioni attuali secondo i date: 55.
La fonte (nome):
Indicatori dello sviluppo mondiale
La fonte (organizzazione):
World Bank staff estimates based data from International Monetary Fund's Direction of Trade database.
Categorie:
Private Sector, Trade
sono stati aggiornati
23 apr 2017 anni
Indicatori delle variazioni dei valori per anni
Minima:
0.012
1 gen 1961 anni
Massimo:
2.447
1 gen 1997 anni
Alla data di osservazione
Valore
Variazione assoluta
La variazione rispetto al valore precedente
1 gen 1961 anni
0.012
+0.012
0.0%
1 gen 1962 anni
0.02
+0.007
58.04%
1 gen 1963 anni
0.057
+0.037
191.88%
1 gen 1964 anni
0.046
-0.011
-19.53%
1 gen 1965 anni
0.079
+0.033
72.0%
1 gen 1966 anni
0.063
-0.016
-20.53%
1 gen 1967 anni
0.096
+0.033
52.65%
1 gen 1968 anni
0.184
+0.089
92.65%
1 gen 1969 anni
0.229
+0.045
24.39%
1 gen 1970 anni
0.305
+0.076
33.05%
1 gen 1971 anni
0.22
-0.084
-27.72%
1 gen 1972 anni
0.542
+0.321
145.8%
1 gen 1973 anni
0.992
+0.45
83.11%
1 gen 1974 anni
0.971
-0.021
-2.08%
1 gen 1975 anni
0.81
-0.161
-16.59%
1 gen 1976 anni
0.584
-0.226
-27.88%
1 gen 1977 anni
0.227
-0.357
-61.06%
1 gen 1978 anni
0.202
-0.025
-11.15%
1 gen 1979 anni
0.126
-0.076
-37.83%
1 gen 1980 anni
0.281
+0.156
123.79%
1 gen 1981 anni
0.25
-0.031
-11.05%
1 gen 1982 anni
0.289
+0.039
15.65%
1 gen 1983 anni
0.334
+0.045
15.42%
1 gen 1984 anni
0.257
-0.077
-23.05%
1 gen 1985 anni
0.183
-0.074
-28.64%
1 gen 1986 anni
0.143
-0.04
-22.0%
1 gen 1987 anni
0.107
-0.036
-24.88%
1 gen 1988 anni
0.898
+0.791
735.87%
1 gen 1989 anni
1.829
+0.931
103.62%
1 gen 1990 anni
0.595
-1.233
-67.43%
1 gen 1991 anni
0.742
+0.147
24.66%
1 gen 1992 anni
1.342
+0.6
80.85%
1 gen 1993 anni
0.445
-0.897
-66.86%
1 gen 1994 anni
0.481
+0.036
8.06%
1 gen 1995 anni
0.508
+0.027
5.7%
1 gen 1996 anni
1.568
+1.059
208.49%
1 gen 1997 anni
2.447
+0.88
56.12%
1 gen 1998 anni
1.23
-1.217
-49.75%
1 gen 1999 anni
0.792
-0.438
-35.58%
1 gen 2000 anni
0.697
-0.095
-12.01%
1 gen 2001 anni
0.612
-0.086
-12.29%
1 gen 2002 anni
0.666
+0.054
8.88%
1 gen 2003 anni
0.201
-0.465
-69.79%
1 gen 2004 anni
0.263
+0.062
30.92%
1 gen 2005 anni
0.206
-0.058
-21.9%
1 gen 2006 anni
0.544
+0.338
164.48%
1 gen 2007 anni
0.993
+0.449
82.56%
1 gen 2008 anni
1.685
+0.693
69.75%
1 gen 2009 anni
2.155
+0.47
27.89%
1 gen 2010 anni
0.553
-1.603
-74.35%
1 gen 2011 anni
0.672
+0.119
21.46%
1 gen 2012 anni
0.944
+0.272
40.58%
1 gen 2013 anni
1.032
+0.088
9.34%
1 gen 2014 anni
0.803
-0.229
-22.21%
1 gen 2015 anni
0.776
-0.027
-3.34%
Classificazione dei paesi secondo i statistiche attuali per anni


Commenti: