29
/it/
it
AIzaSyAYiBZKx7MnpbEhh9jyipgxe19OcubqV5w
April 1, 2024
74158
Austria
AUT
true
2
1
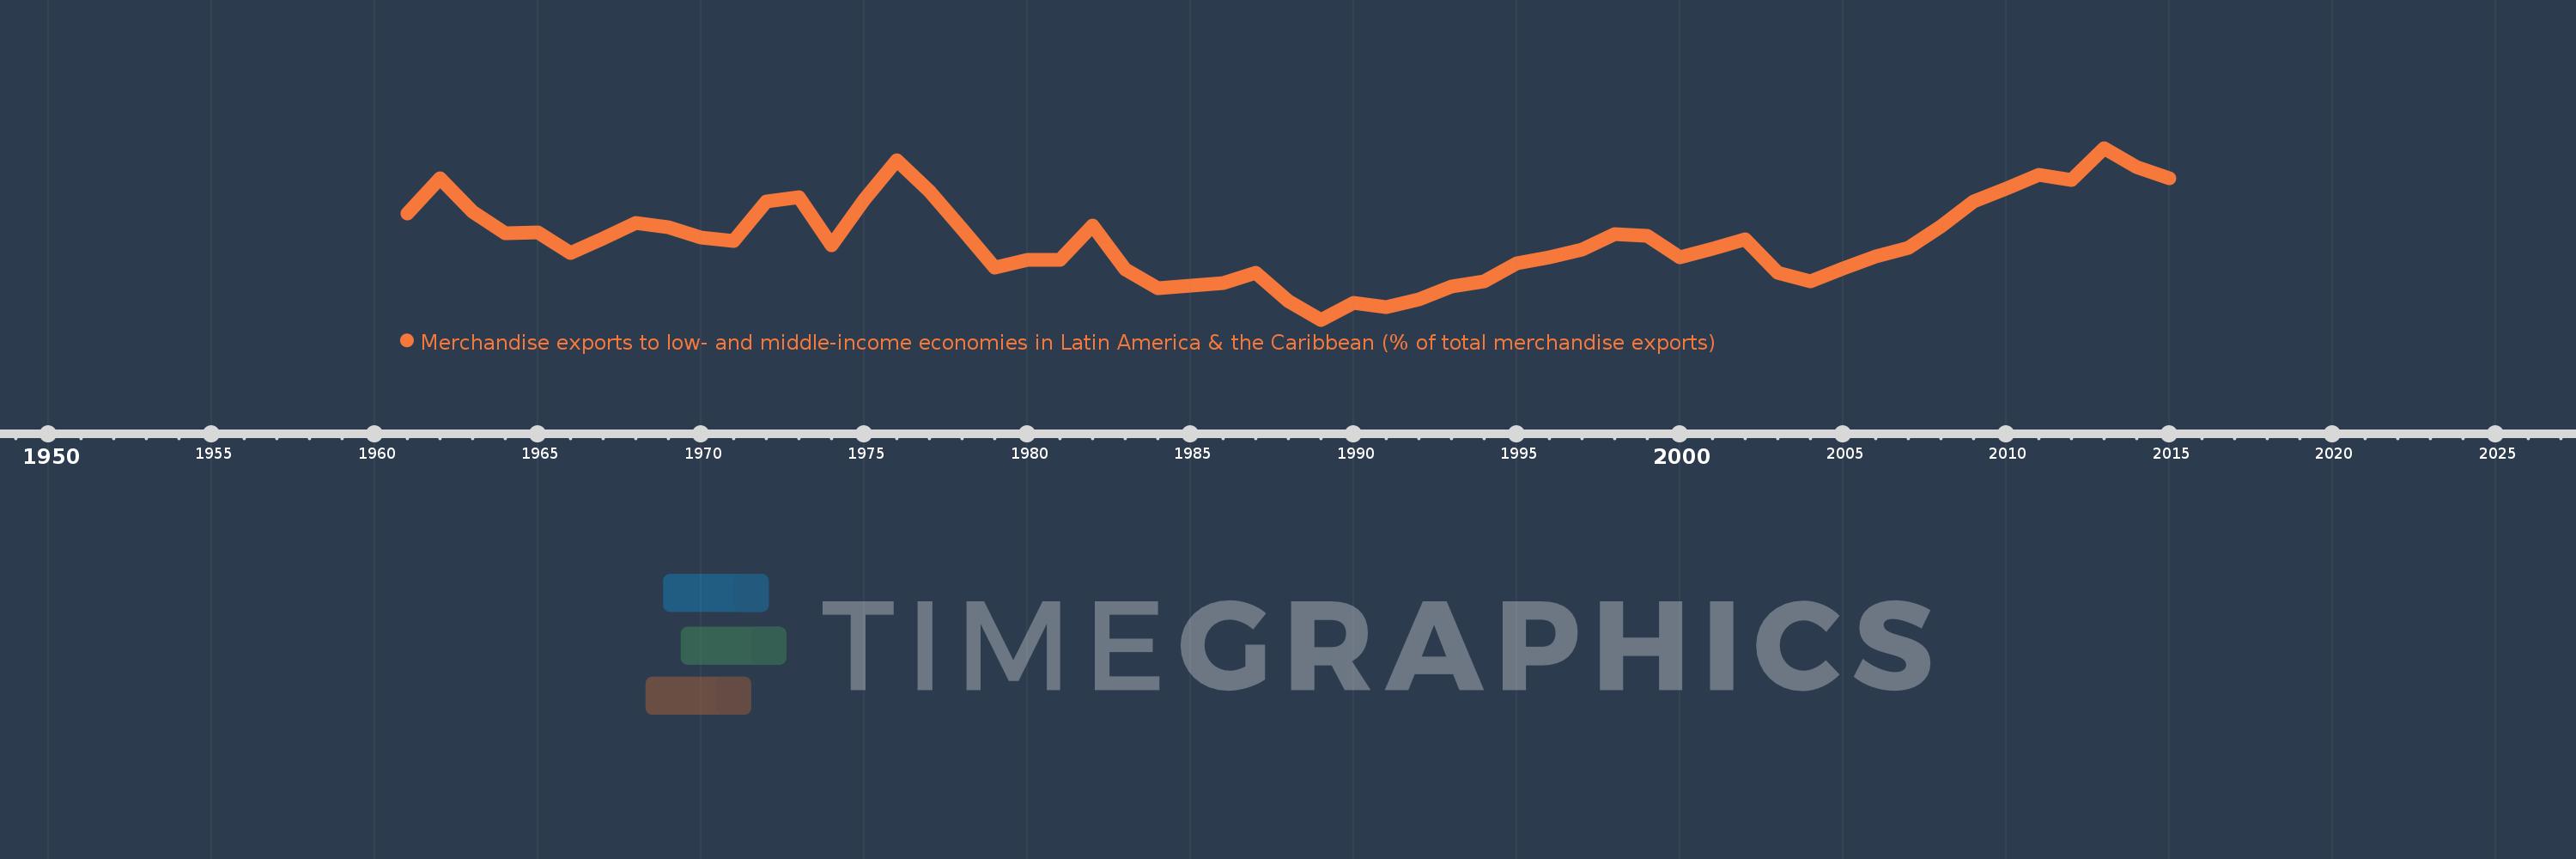
Merchandise exports to low- and middle-income economies in Latin America & the Caribbean (% of total merchandise exports)
2015,2014,2013,2012,2011,2010,2009,2008,2007,2006,2005,2004,2003,2002,2001,2000,1999,1998,1997,1996,1995,1994,1993,1992,1991,1990,1989,1988,1987,1986,1985,1984,1983,1982,1981,1980,1979,1978,1977,1976,1975,1974,1973,1972,1971,1970,1969,1968,1967,1966,1965,1964,1963,1962,1961
Queste statistiche in altri paesi:
AfghanistanAlbaniaAlgeriaAngolaAntigua and BarbudaArab WorldArgentinaArmeniaArubaAustraliaAustriaAzerbaijanBahamas, TheBahrainBangladeshBarbadosBelarusBelgiumBelizeBeninBermudaBoliviaBrazilBrunei DarussalamBulgariaBurundiCabo VerdeCambodiaCameroonCanadaCaribbean small statesCentral African RepublicCentral Europe and the BalticsChileChinaColombiaCongo, Dem. Rep.Congo, Rep.Costa RicaCote d'IvoireCroatiaCubaCyprusCzech RepublicDenmarkDominicaDominican RepublicEarly-demographic dividendEast Asia & PacificEast Asia & Pacific (excluding high income)East Asia & Pacific (IDA & IBRD countries)EcuadorEgypt, Arab Rep.El SalvadorEstoniaEthiopiaEuro areaEurope & Central AsiaEurope & Central Asia (excluding high income)Europe & Central Asia (IDA & IBRD countries)European UnionFaroe IslandsFijiFinlandFragile and conflict affected situationsFranceFrench PolynesiaGabonGambia, TheGeorgiaGermanyGhanaGibraltarGreeceGreenlandGrenadaGuatemalaGuineaGuyanaHaitiHeavily indebted poor countries (HIPC)High incomeHondurasHong Kong SAR, ChinaHungaryIBRD onlyIcelandIDA & IBRD totalIDA blendIDA onlyIDA totalIndiaIndonesiaIran, Islamic Rep.IraqIrelandIsraelItalyJamaicaJapanJordanKazakhstanKenyaKorea, Dem. People’s Rep.Korea, Rep.KuwaitLao PDRLate-demographic dividendLatin America & Caribbean Latin America & Caribbean (excluding high income)Latin America & the Caribbean (IDA & IBRD countries)LatviaLeast developed countries: UN classificationLebanonLiberiaLibyaLithuaniaLow & middle incomeLow incomeLower middle incomeLuxembourgMacao SAR, ChinaMacedonia, FYRMadagascarMalawiMalaysiaMaliMaltaMauritaniaMauritiusMexicoMiddle East & North AfricaMiddle East & North Africa (excluding high income)Middle East & North Africa (IDA & IBRD countries)Middle incomeMongoliaMontenegroMoroccoMozambiqueMyanmarNetherlandsNew CaledoniaNew ZealandNicaraguaNigerNigeriaNorth AmericaNorwayOECD membersOmanOther small statesPacific island small statesPakistanPanamaPapua New GuineaParaguayPeruPhilippinesPolandPortugalPost-demographic dividendPre-demographic dividendQatarRomaniaRussian FederationRwandaSamoaSaudi ArabiaSenegalSerbiaSierra LeoneSingaporeSlovak RepublicSloveniaSmall statesSomaliaSouth AfricaSouth AsiaSouth Asia (IDA & IBRD)SpainSri LankaSt. Kitts and NevisSt. LuciaSt. Vincent and the GrenadinesSub-Saharan Africa Sub-Saharan Africa (excluding high income)Sub-Saharan Africa (IDA & IBRD countries)SudanSurinameSwedenSwitzerlandSyrian Arab RepublicTanzaniaThailandTogoTrinidad and TobagoTunisiaTurkeyUgandaUkraineUnited Arab EmiratesUnited KingdomUnited StatesUpper middle incomeUruguayVenezuela, RBVietnamWorldYemen, Rep.ZambiaZimbabwe Linea del tempo:
Questa scala temporale mostra un grafico dal 1961 anno al 2015 anno. Austria. I dati fino ad 1960 anno non disponibili. Il numero di osservazioni attuali secondo i date: 55.
La fonte (nome):
Indicatori dello sviluppo mondiale
La fonte (organizzazione):
World Bank staff estimates based data from International Monetary Fund's Direction of Trade database.
Categorie:
Private Sector, Trade
sono stati aggiornati
23 apr 2017 anni
Indicatori delle variazioni dei valori per anni
Minima:
0.322
1 gen 1989 anni
Massimo:
1.49
1 gen 2013 anni
Alla data di osservazione
Valore
Variazione assoluta
La variazione rispetto al valore precedente
1 gen 1961 anni
1.046
+1.046
0.0%
1 gen 1962 anni
1.283
+0.238
22.73%
1 gen 1963 anni
1.054
-0.229
-17.83%
1 gen 1964 anni
0.908
-0.147
-13.94%
1 gen 1965 anni
0.917
+0.01
1.09%
1 gen 1966 anni
0.777
-0.14
-15.29%
1 gen 1967 anni
0.874
+0.097
12.42%
1 gen 1968 anni
0.978
+0.104
11.95%
1 gen 1969 anni
0.95
-0.028
-2.88%
1 gen 1970 anni
0.879
-0.071
-7.46%
1 gen 1971 anni
0.86
-0.019
-2.16%
1 gen 1972 anni
1.125
+0.265
30.85%
1 gen 1973 anni
1.156
+0.031
2.75%
1 gen 1974 anni
0.83
-0.326
-28.23%
1 gen 1975 anni
1.137
+0.307
36.96%
1 gen 1976 anni
1.405
+0.269
23.66%
1 gen 1977 anni
1.198
-0.208
-14.77%
1 gen 1978 anni
0.939
-0.259
-21.65%
1 gen 1979 anni
0.676
-0.262
-27.93%
1 gen 1980 anni
0.731
+0.055
8.08%
1 gen 1981 anni
0.729
-0.002
-0.32%
1 gen 1982 anni
0.965
+0.236
32.44%
1 gen 1983 anni
0.663
-0.302
-31.34%
1 gen 1984 anni
0.536
-0.126
-19.09%
1 gen 1985 anni
0.555
+0.019
3.57%
1 gen 1986 anni
0.569
+0.013
2.41%
1 gen 1987 anni
0.64
+0.072
12.59%
1 gen 1988 anni
0.446
-0.194
-30.33%
1 gen 1989 anni
0.322
-0.125
-27.92%
1 gen 1990 anni
0.439
+0.117
36.42%
1 gen 1991 anni
0.41
-0.029
-6.56%
1 gen 1992 anni
0.461
+0.051
12.54%
1 gen 1993 anni
0.55
+0.088
19.14%
1 gen 1994 anni
0.581
+0.032
5.73%
1 gen 1995 anni
0.708
+0.127
21.83%
1 gen 1996 anni
0.745
+0.037
5.22%
1 gen 1997 anni
0.802
+0.057
7.72%
1 gen 1998 anni
0.903
+0.101
12.54%
1 gen 1999 anni
0.892
-0.011
-1.22%
1 gen 2000 anni
0.746
-0.146
-16.35%
1 gen 2001 anni
0.804
+0.058
7.78%
1 gen 2002 anni
0.87
+0.066
8.18%
1 gen 2003 anni
0.64
-0.23
-26.43%
1 gen 2004 anni
0.581
-0.059
-9.22%
1 gen 2005 anni
0.668
+0.087
15.0%
1 gen 2006 anni
0.753
+0.085
12.71%
1 gen 2007 anni
0.81
+0.057
7.58%
1 gen 2008 anni
0.954
+0.144
17.75%
1 gen 2009 anni
1.125
+0.17
17.86%
1 gen 2010 anni
1.212
+0.087
7.77%
1 gen 2011 anni
1.305
+0.093
7.66%
1 gen 2012 anni
1.272
-0.032
-2.49%
1 gen 2013 anni
1.49
+0.218
17.13%
1 gen 2014 anni
1.358
-0.132
-8.87%
1 gen 2015 anni
1.285
-0.073
-5.36%
Classificazione dei paesi secondo i statistiche attuali per anni


Commenti: