29
/it/
it
AIzaSyAYiBZKx7MnpbEhh9jyipgxe19OcubqV5w
April 1, 2024
249006
Sri Lanka
LKA
true
2
1
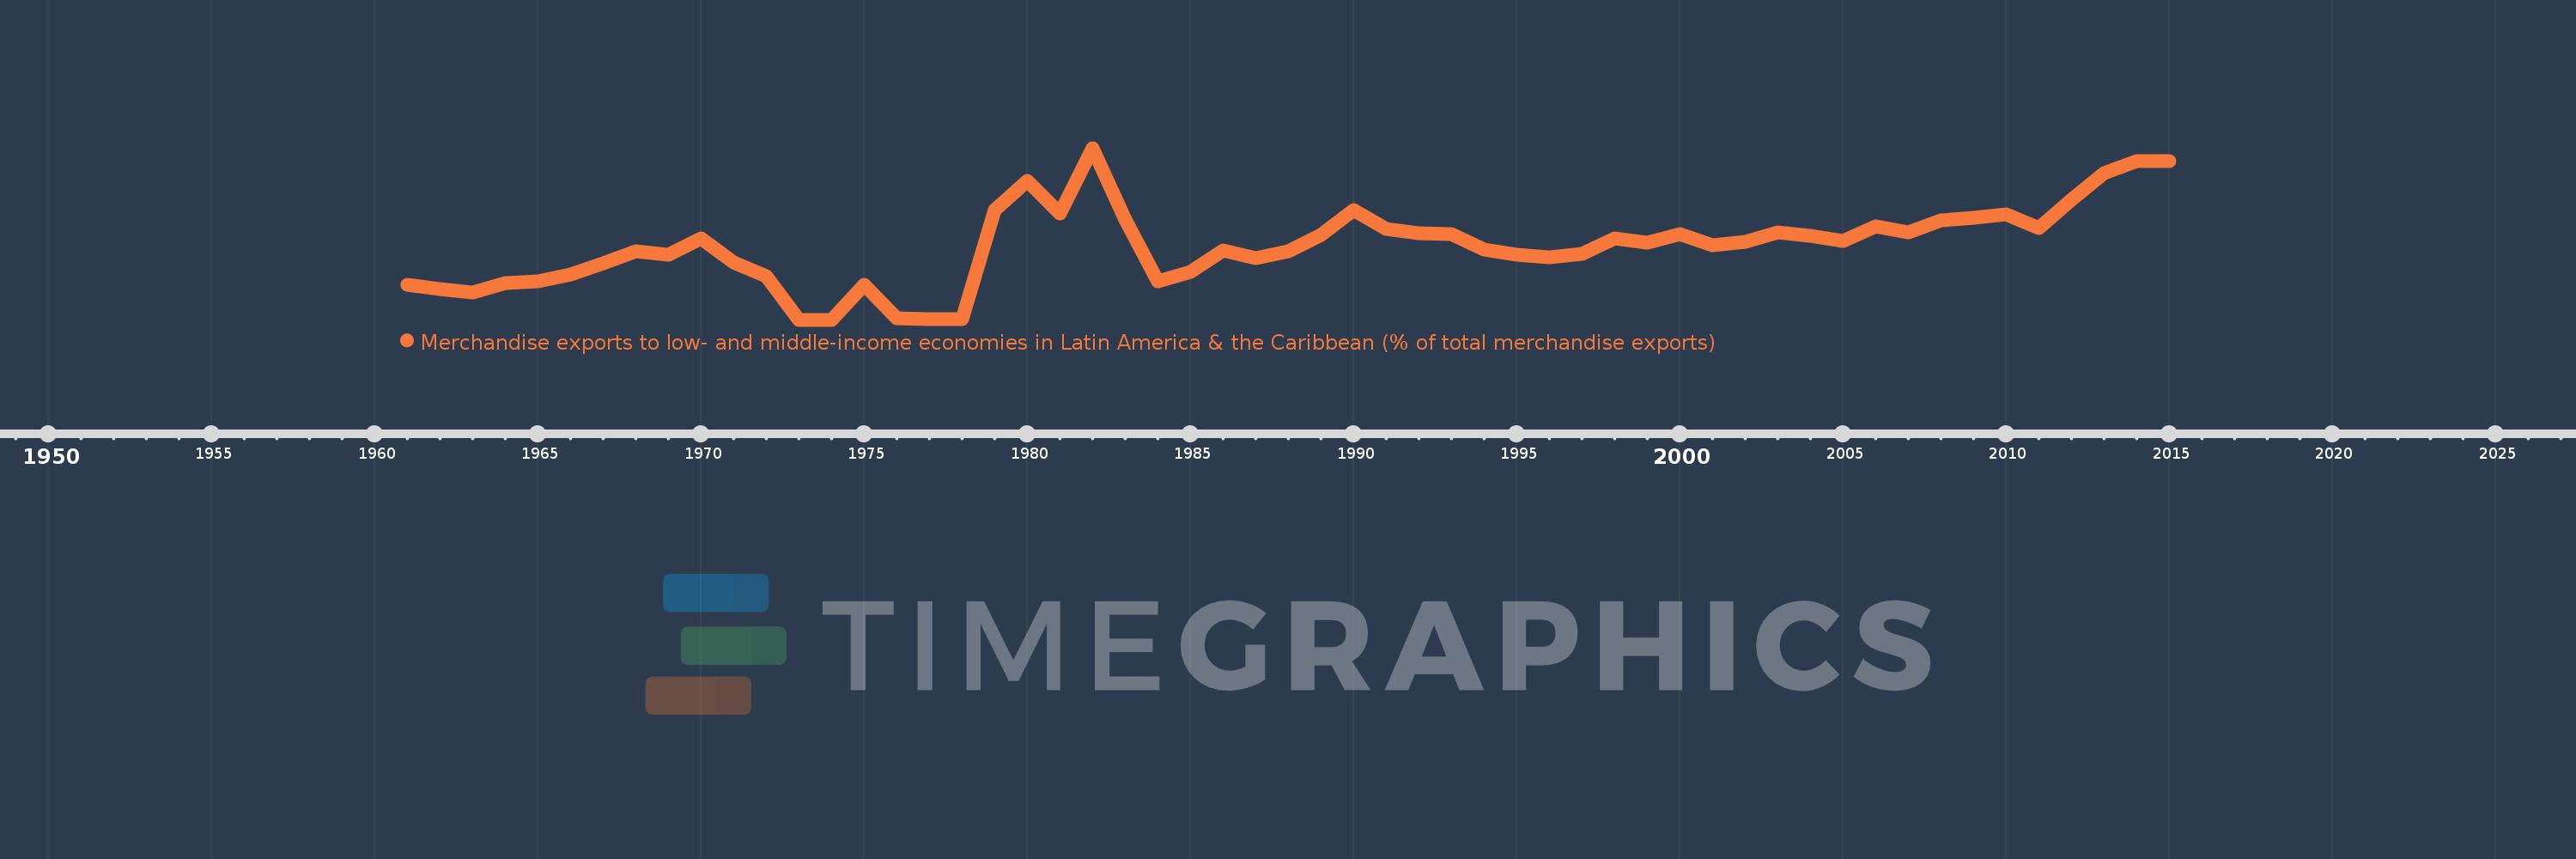
Merchandise exports to low- and middle-income economies in Latin America & the Caribbean (% of total merchandise exports)
2015,2014,2013,2012,2011,2010,2009,2008,2007,2006,2005,2004,2003,2002,2001,2000,1999,1998,1997,1996,1995,1994,1993,1992,1991,1990,1989,1988,1987,1986,1985,1984,1983,1982,1981,1980,1979,1978,1977,1976,1975,1974,1973,1972,1971,1970,1969,1968,1967,1966,1965,1964,1963,1962,1961
Queste statistiche in altri paesi:
AfghanistanAlbaniaAlgeriaAngolaAntigua and BarbudaArab WorldArgentinaArmeniaArubaAustraliaAustriaAzerbaijanBahamas, TheBahrainBangladeshBarbadosBelarusBelgiumBelizeBeninBermudaBoliviaBrazilBrunei DarussalamBulgariaBurundiCabo VerdeCambodiaCameroonCanadaCaribbean small statesCentral African RepublicCentral Europe and the BalticsChileChinaColombiaCongo, Dem. Rep.Congo, Rep.Costa RicaCote d'IvoireCroatiaCubaCyprusCzech RepublicDenmarkDominicaDominican RepublicEarly-demographic dividendEast Asia & PacificEast Asia & Pacific (excluding high income)East Asia & Pacific (IDA & IBRD countries)EcuadorEgypt, Arab Rep.El SalvadorEstoniaEthiopiaEuro areaEurope & Central AsiaEurope & Central Asia (excluding high income)Europe & Central Asia (IDA & IBRD countries)European UnionFaroe IslandsFijiFinlandFragile and conflict affected situationsFranceFrench PolynesiaGabonGambia, TheGeorgiaGermanyGhanaGibraltarGreeceGreenlandGrenadaGuatemalaGuineaGuyanaHaitiHeavily indebted poor countries (HIPC)High incomeHondurasHong Kong SAR, ChinaHungaryIBRD onlyIcelandIDA & IBRD totalIDA blendIDA onlyIDA totalIndiaIndonesiaIran, Islamic Rep.IraqIrelandIsraelItalyJamaicaJapanJordanKazakhstanKenyaKorea, Dem. People’s Rep.Korea, Rep.KuwaitLao PDRLate-demographic dividendLatin America & Caribbean Latin America & Caribbean (excluding high income)Latin America & the Caribbean (IDA & IBRD countries)LatviaLeast developed countries: UN classificationLebanonLiberiaLibyaLithuaniaLow & middle incomeLow incomeLower middle incomeLuxembourgMacao SAR, ChinaMacedonia, FYRMadagascarMalawiMalaysiaMaliMaltaMauritaniaMauritiusMexicoMiddle East & North AfricaMiddle East & North Africa (excluding high income)Middle East & North Africa (IDA & IBRD countries)Middle incomeMongoliaMontenegroMoroccoMozambiqueMyanmarNetherlandsNew CaledoniaNew ZealandNicaraguaNigerNigeriaNorth AmericaNorwayOECD membersOmanOther small statesPacific island small statesPakistanPanamaPapua New GuineaParaguayPeruPhilippinesPolandPortugalPost-demographic dividendPre-demographic dividendQatarRomaniaRussian FederationRwandaSamoaSaudi ArabiaSenegalSerbiaSierra LeoneSingaporeSlovak RepublicSloveniaSmall statesSomaliaSouth AfricaSouth AsiaSouth Asia (IDA & IBRD)SpainSri LankaSt. Kitts and NevisSt. LuciaSt. Vincent and the GrenadinesSub-Saharan Africa Sub-Saharan Africa (excluding high income)Sub-Saharan Africa (IDA & IBRD countries)SudanSurinameSwedenSwitzerlandSyrian Arab RepublicTanzaniaThailandTogoTrinidad and TobagoTunisiaTurkeyUgandaUkraineUnited Arab EmiratesUnited KingdomUnited StatesUpper middle incomeUruguayVenezuela, RBVietnamWorldYemen, Rep.ZambiaZimbabwe Linea del tempo:
Questa scala temporale mostra un grafico dal 1961 anno al 2015 anno. Sri Lanka. I dati fino ad 1960 anno non disponibili. Il numero di osservazioni attuali secondo i date: 55.
La fonte (nome):
Indicatori dello sviluppo mondiale
La fonte (organizzazione):
World Bank staff estimates based data from International Monetary Fund's Direction of Trade database.
Categorie:
Private Sector, Trade
sono stati aggiornati
23 apr 2017 anni
Indicatori delle variazioni dei valori per anni
Minima:
0.0
1 gen 1973 anni
Massimo:
2.235
1 gen 1982 anni
Alla data di osservazione
Valore
Variazione assoluta
La variazione rispetto al valore precedente
1 gen 1961 anni
0.456
+0.456
0.0%
1 gen 1962 anni
0.397
-0.06
-13.07%
1 gen 1963 anni
0.351
-0.046
-11.55%
1 gen 1964 anni
0.475
+0.124
35.3%
1 gen 1965 anni
0.494
+0.02
4.17%
1 gen 1966 anni
0.588
+0.094
18.95%
1 gen 1967 anni
0.739
+0.151
25.71%
1 gen 1968 anni
0.891
+0.151
20.49%
1 gen 1969 anni
0.845
-0.045
-5.09%
1 gen 1970 anni
1.055
+0.21
24.82%
1 gen 1971 anni
0.743
-0.312
-29.55%
1 gen 1972 anni
0.566
-0.177
-23.81%
1 gen 1973 anni
0.0
-0.566
-100.0%
1 gen 1975 anni
0.46
+0.46
%
1 gen 1976 anni
0.015
-0.445
-96.76%
1 gen 1977 anni
0.005
-0.01
-68.85%
1 gen 1978 anni
0.012
+0.008
166.5%
1 gen 1979 anni
1.43
+1.418
11.45 Mille.%
1 gen 1980 anni
1.802
+0.372
26.01%
1 gen 1981 anni
1.383
-0.42
-23.27%
1 gen 1982 anni
2.235
+0.852
61.61%
1 gen 1983 anni
1.3
-0.935
-41.82%
1 gen 1984 anni
0.504
-0.796
-61.23%
1 gen 1985 anni
0.618
+0.114
22.58%
1 gen 1986 anni
0.901
+0.283
45.76%
1 gen 1987 anni
0.801
-0.1
-11.09%
1 gen 1988 anni
0.891
+0.09
11.26%
1 gen 1989 anni
1.106
+0.215
24.18%
1 gen 1990 anni
1.429
+0.323
29.16%
1 gen 1991 anni
1.183
-0.246
-17.24%
1 gen 1992 anni
1.13
-0.052
-4.43%
1 gen 1993 anni
1.118
-0.012
-1.06%
1 gen 1994 anni
0.91
-0.208
-18.6%
1 gen 1995 anni
0.844
-0.066
-7.28%
1 gen 1996 anni
0.816
-0.028
-3.37%
1 gen 1997 anni
0.856
+0.04
4.95%
1 gen 1998 anni
1.059
+0.203
23.67%
1 gen 1999 anni
0.998
-0.06
-5.71%
1 gen 2000 anni
1.118
+0.12
11.98%
1 gen 2001 anni
0.974
-0.144
-12.88%
1 gen 2002 anni
1.008
+0.034
3.5%
1 gen 2003 anni
1.137
+0.13
12.85%
1 gen 2004 anni
1.097
-0.04
-3.53%
1 gen 2005 anni
1.028
-0.07
-6.35%
1 gen 2006 anni
1.214
+0.186
18.13%
1 gen 2007 anni
1.133
-0.081
-6.63%
1 gen 2008 anni
1.296
+0.163
14.36%
1 gen 2009 anni
1.332
+0.036
2.76%
1 gen 2010 anni
1.369
+0.037
2.8%
1 gen 2011 anni
1.189
-0.18
-13.15%
1 gen 2012 anni
1.565
+0.376
31.62%
1 gen 2013 anni
1.904
+0.339
21.69%
1 gen 2014 anni
2.065
+0.16
8.41%
1 gen 2015 anni
2.068
+0.003
0.14%
Classificazione dei paesi secondo i statistiche attuali per anni


Commenti: