29
/it/
it
AIzaSyAYiBZKx7MnpbEhh9jyipgxe19OcubqV5w
April 1, 2024
125079
Egypt, Arab Rep.
EGY
true
2
1
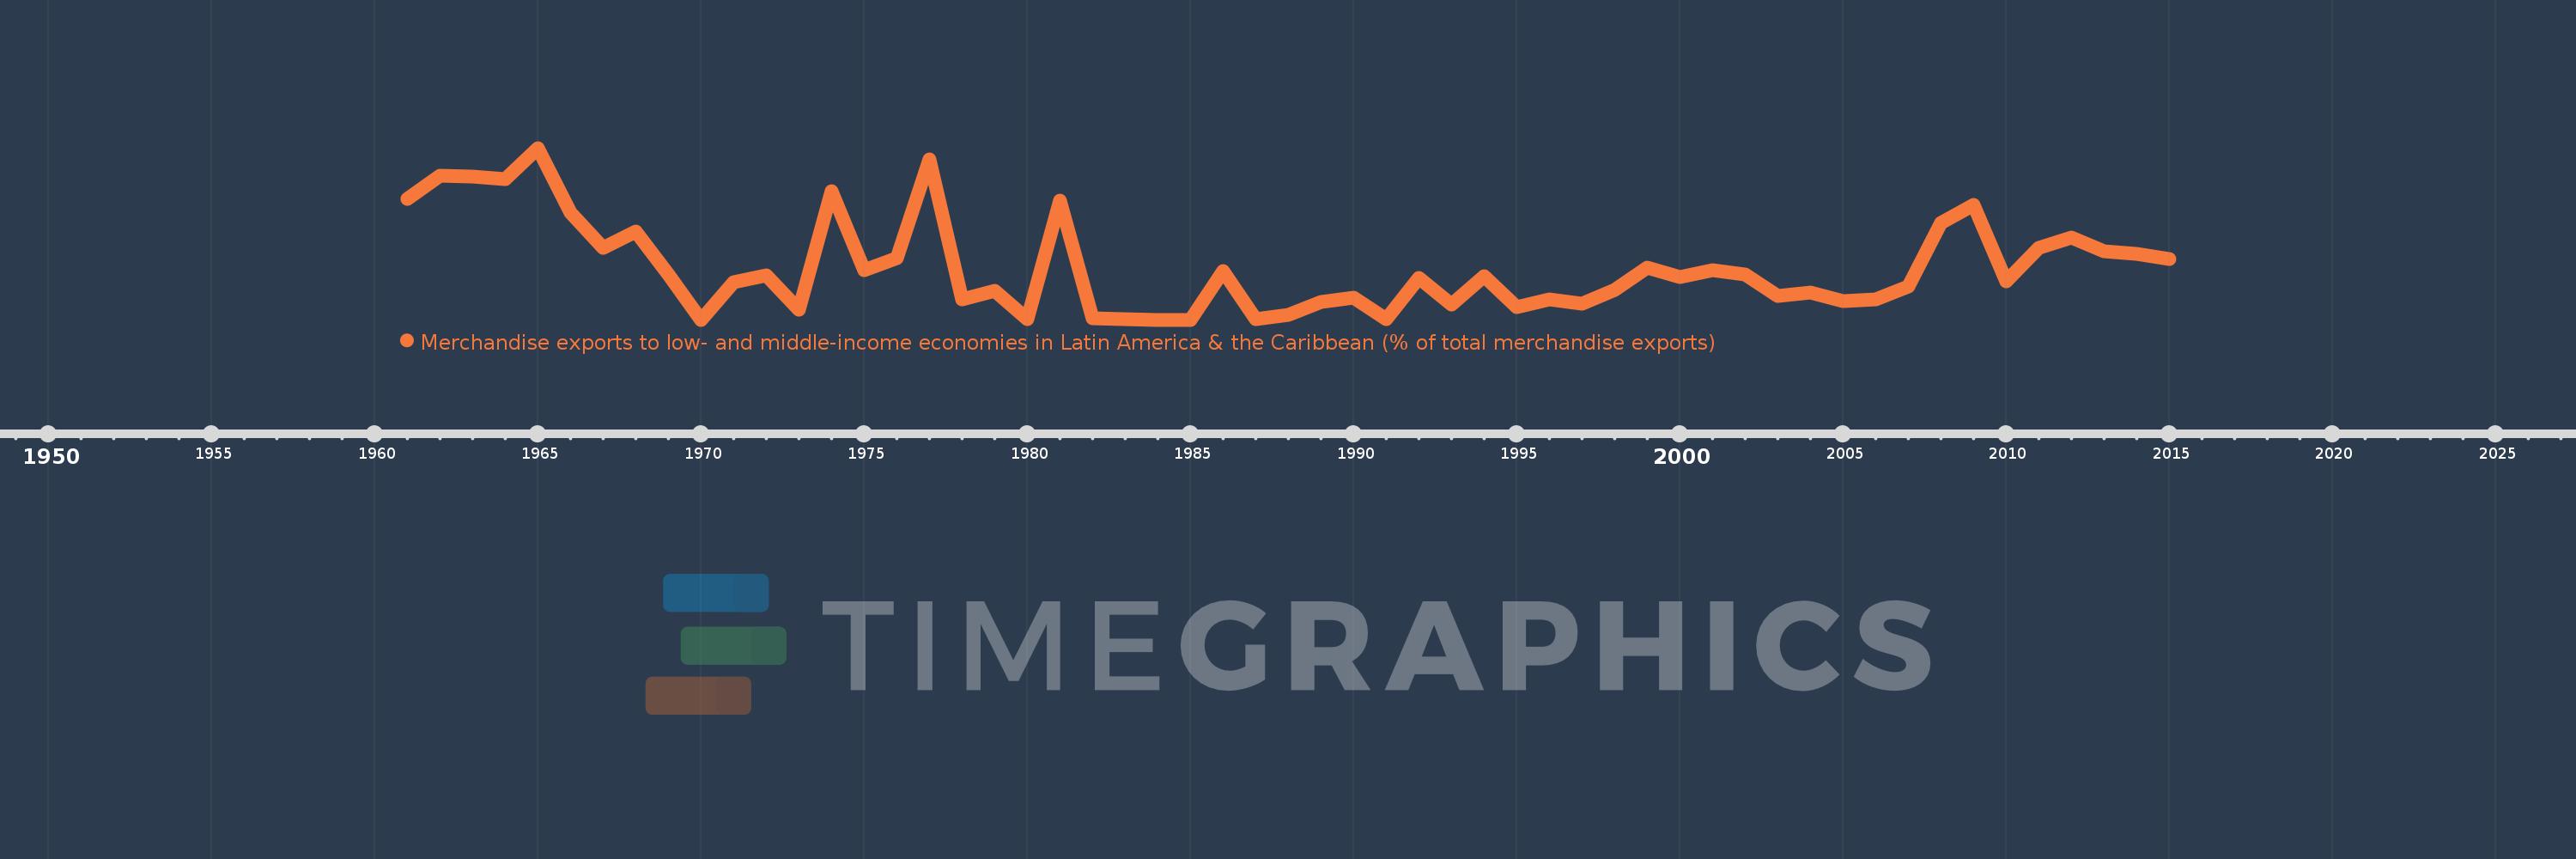
Merchandise exports to low- and middle-income economies in Latin America & the Caribbean (% of total merchandise exports)
2015,2014,2013,2012,2011,2010,2009,2008,2007,2006,2005,2004,2003,2002,2001,2000,1999,1998,1997,1996,1995,1994,1993,1992,1991,1990,1989,1988,1987,1986,1985,1984,1983,1982,1981,1980,1979,1978,1977,1976,1975,1974,1973,1972,1971,1970,1969,1968,1967,1966,1965,1964,1963,1962,1961
Queste statistiche in altri paesi:
AfghanistanAlbaniaAlgeriaAngolaAntigua and BarbudaArab WorldArgentinaArmeniaArubaAustraliaAustriaAzerbaijanBahamas, TheBahrainBangladeshBarbadosBelarusBelgiumBelizeBeninBermudaBoliviaBrazilBrunei DarussalamBulgariaBurundiCabo VerdeCambodiaCameroonCanadaCaribbean small statesCentral African RepublicCentral Europe and the BalticsChileChinaColombiaCongo, Dem. Rep.Congo, Rep.Costa RicaCote d'IvoireCroatiaCubaCyprusCzech RepublicDenmarkDominicaDominican RepublicEarly-demographic dividendEast Asia & PacificEast Asia & Pacific (excluding high income)East Asia & Pacific (IDA & IBRD countries)EcuadorEgypt, Arab Rep.El SalvadorEstoniaEthiopiaEuro areaEurope & Central AsiaEurope & Central Asia (excluding high income)Europe & Central Asia (IDA & IBRD countries)European UnionFaroe IslandsFijiFinlandFragile and conflict affected situationsFranceFrench PolynesiaGabonGambia, TheGeorgiaGermanyGhanaGibraltarGreeceGreenlandGrenadaGuatemalaGuineaGuyanaHaitiHeavily indebted poor countries (HIPC)High incomeHondurasHong Kong SAR, ChinaHungaryIBRD onlyIcelandIDA & IBRD totalIDA blendIDA onlyIDA totalIndiaIndonesiaIran, Islamic Rep.IraqIrelandIsraelItalyJamaicaJapanJordanKazakhstanKenyaKorea, Dem. People’s Rep.Korea, Rep.KuwaitLao PDRLate-demographic dividendLatin America & Caribbean Latin America & Caribbean (excluding high income)Latin America & the Caribbean (IDA & IBRD countries)LatviaLeast developed countries: UN classificationLebanonLiberiaLibyaLithuaniaLow & middle incomeLow incomeLower middle incomeLuxembourgMacao SAR, ChinaMacedonia, FYRMadagascarMalawiMalaysiaMaliMaltaMauritaniaMauritiusMexicoMiddle East & North AfricaMiddle East & North Africa (excluding high income)Middle East & North Africa (IDA & IBRD countries)Middle incomeMongoliaMontenegroMoroccoMozambiqueMyanmarNetherlandsNew CaledoniaNew ZealandNicaraguaNigerNigeriaNorth AmericaNorwayOECD membersOmanOther small statesPacific island small statesPakistanPanamaPapua New GuineaParaguayPeruPhilippinesPolandPortugalPost-demographic dividendPre-demographic dividendQatarRomaniaRussian FederationRwandaSamoaSaudi ArabiaSenegalSerbiaSierra LeoneSingaporeSlovak RepublicSloveniaSmall statesSomaliaSouth AfricaSouth AsiaSouth Asia (IDA & IBRD)SpainSri LankaSt. Kitts and NevisSt. LuciaSt. Vincent and the GrenadinesSub-Saharan Africa Sub-Saharan Africa (excluding high income)Sub-Saharan Africa (IDA & IBRD countries)SudanSurinameSwedenSwitzerlandSyrian Arab RepublicTanzaniaThailandTogoTrinidad and TobagoTunisiaTurkeyUgandaUkraineUnited Arab EmiratesUnited KingdomUnited StatesUpper middle incomeUruguayVenezuela, RBVietnamWorldYemen, Rep.ZambiaZimbabwe Linea del tempo:
Questa scala temporale mostra un grafico dal 1961 anno al 2015 anno. Egypt, Arab Rep.. I dati fino ad 1960 anno non disponibili. Il numero di osservazioni attuali secondo i date: 55.
La fonte (nome):
Indicatori dello sviluppo mondiale
La fonte (organizzazione):
World Bank staff estimates based data from International Monetary Fund's Direction of Trade database.
Categorie:
Private Sector, Trade
sono stati aggiornati
23 apr 2017 anni
Indicatori delle variazioni dei valori per anni
Minima:
0.0
1 gen 1970 anni
Massimo:
2.435
1 gen 1965 anni
Alla data di osservazione
Valore
Variazione assoluta
La variazione rispetto al valore precedente
1 gen 1961 anni
1.711
+1.711
0.0%
1 gen 1962 anni
2.044
+0.333
19.45%
1 gen 1963 anni
2.029
-0.015
-0.74%
1 gen 1964 anni
1.994
-0.035
-1.73%
1 gen 1965 anni
2.435
+0.441
22.12%
1 gen 1966 anni
1.52
-0.915
-37.57%
1 gen 1967 anni
1.023
-0.497
-32.69%
1 gen 1968 anni
1.253
+0.23
22.46%
1 gen 1969 anni
0.646
-0.607
-48.45%
1 gen 1970 anni
0.0
-0.646
-100.0%
1 gen 1971 anni
0.537
+0.537
%
1 gen 1972 anni
0.625
+0.088
16.46%
1 gen 1973 anni
0.142
-0.484
-77.33%
1 gen 1974 anni
1.823
+1.681
1.19 Mille.%
1 gen 1975 anni
0.7
-1.122
-61.58%
1 gen 1976 anni
0.869
+0.169
24.07%
1 gen 1977 anni
2.267
+1.398
160.82%
1 gen 1978 anni
0.29
-1.977
-87.22%
1 gen 1979 anni
0.414
+0.125
43.04%
1 gen 1980 anni
0.012
-0.403
-97.11%
1 gen 1981 anni
1.693
+1.681
14.06 Mille.%
1 gen 1982 anni
0.019
-1.675
-98.9%
1 gen 1983 anni
0.007
-0.012
-63.74%
1 gen 1984 anni
0.001
-0.006
-86.14%
1 gen 1985 anni
0.001
0.0
-31.74%
1 gen 1986 anni
0.694
+0.694
108.93 Mille.%
1 gen 1987 anni
0.012
-0.682
-98.27%
1 gen 1988 anni
0.073
+0.061
512.01%
1 gen 1989 anni
0.254
+0.18
245.15%
1 gen 1990 anni
0.307
+0.053
20.87%
1 gen 1991 anni
0.006
-0.3
-97.98%
1 gen 1992 anni
0.595
+0.588
9.51 Mille.%
1 gen 1993 anni
0.215
-0.379
-63.79%
1 gen 1994 anni
0.613
+0.398
184.9%
1 gen 1995 anni
0.179
-0.434
-70.83%
1 gen 1996 anni
0.293
+0.114
63.72%
1 gen 1997 anni
0.229
-0.064
-21.7%
1 gen 1998 anni
0.423
+0.194
84.64%
1 gen 1999 anni
0.735
+0.312
73.67%
1 gen 2000 anni
0.609
-0.127
-17.23%
1 gen 2001 anni
0.701
+0.092
15.13%
1 gen 2002 anni
0.646
-0.054
-7.76%
1 gen 2003 anni
0.34
-0.307
-47.46%
1 gen 2004 anni
0.385
+0.045
13.35%
1 gen 2005 anni
0.266
-0.119
-30.91%
1 gen 2006 anni
0.293
+0.027
10.13%
1 gen 2007 anni
0.472
+0.179
61.06%
1 gen 2008 anni
1.369
+0.897
190.09%
1 gen 2009 anni
1.63
+0.261
19.06%
1 gen 2010 anni
0.543
-1.086
-66.67%
1 gen 2011 anni
1.014
+0.471
86.74%
1 gen 2012 anni
1.171
+0.157
15.45%
1 gen 2013 anni
0.97
-0.201
-17.2%
1 gen 2014 anni
0.93
-0.04
-4.09%
1 gen 2015 anni
0.863
-0.067
-7.17%
Classificazione dei paesi secondo i statistiche attuali per anni


Commenti: