29
/it/
it
AIzaSyAYiBZKx7MnpbEhh9jyipgxe19OcubqV5w
April 1, 2024
76820
Bahrain
BHR
true
2
1
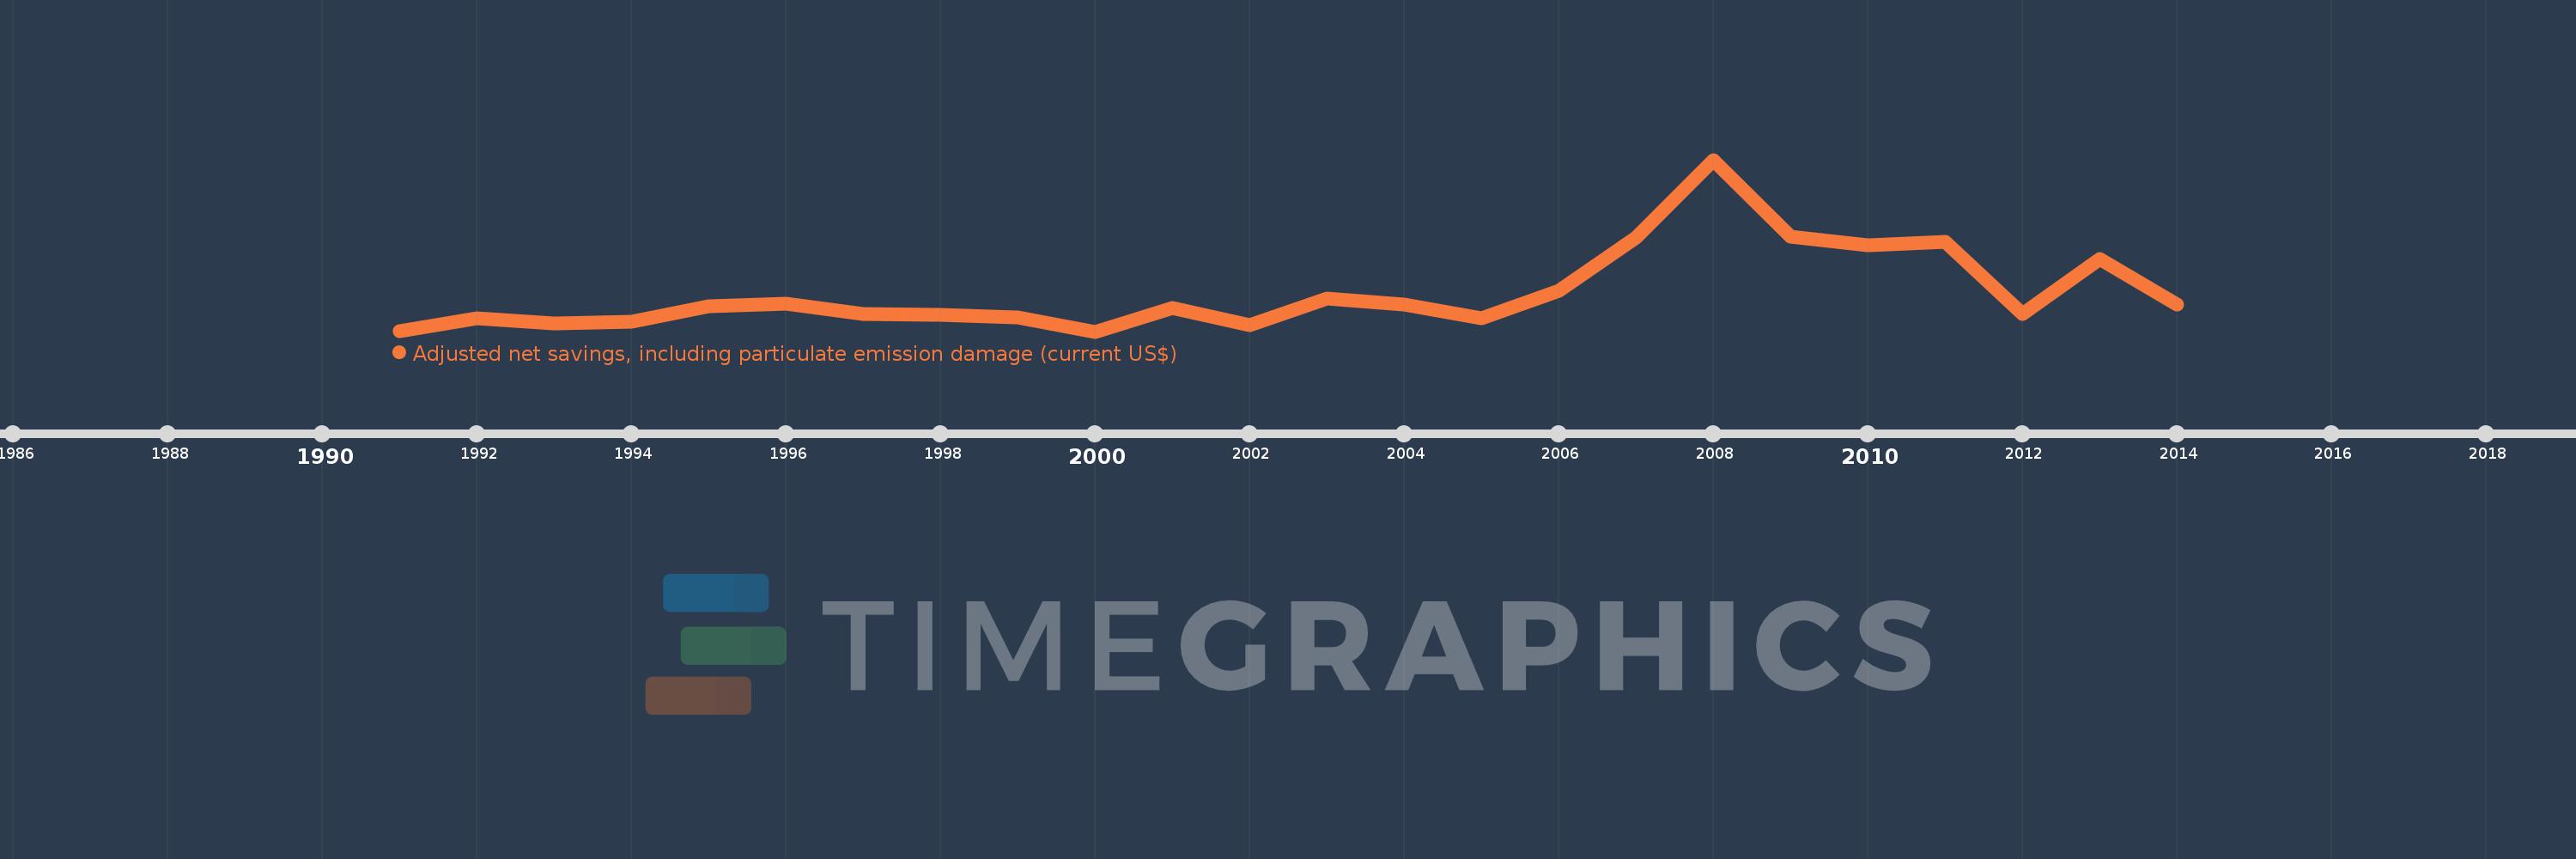
Adjusted net savings, including particulate emission damage (current US$)
2014,2013,2012,2011,2010,2009,2008,2007,2006,2005,2004,2003,2002,2001,2000,1999,1998,1997,1996,1995,1994,1993,1992,1991
Queste statistiche in altri paesi:
AfghanistanAlbaniaAlgeriaAngolaArgentinaArmeniaAustraliaAustriaAzerbaijanBahamas, TheBahrainBangladeshBarbadosBelarusBelgiumBelizeBeninBhutanBoliviaBotswanaBrazilBrunei DarussalamBulgariaBurkina FasoBurundiCabo VerdeCambodiaCameroonCanadaCentral African RepublicChadChileChinaColombiaComorosCongo, Dem. Rep.Congo, Rep.Costa RicaCote d'IvoireCroatiaCyprusCzech RepublicDenmarkDominican RepublicEcuadorEgypt, Arab Rep.El SalvadorEquatorial GuineaEritreaEstoniaEthiopiaFijiFinlandFranceGabonGambia, TheGeorgiaGermanyGhanaGreeceGuatemalaGuineaGuinea-BissauGuyanaHaitiHondurasHungaryIcelandIndiaIndonesiaIran, Islamic Rep.IraqIrelandIsraelItalyJamaicaJapanJordanKazakhstanKenyaKorea, Rep.KuwaitKyrgyz RepublicLao PDRLatviaLebanonLesothoLiberiaLibyaLithuaniaLuxembourgMacedonia, FYRMadagascarMalawiMalaysiaMaldivesMaliMauritaniaMauritiusMexicoMoldovaMongoliaMoroccoMozambiqueNamibiaNepalNetherlandsNew ZealandNicaraguaNigerNigeriaNorwayOmanPakistanPanamaPapua New GuineaParaguayPeruPhilippinesPolandPortugalQatarRomaniaRussian FederationRwandaSaudi ArabiaSenegalSierra LeoneSingaporeSlovak RepublicSloveniaSolomon IslandsSouth AfricaSpainSri LankaSudanSurinameSwazilandSwedenSwitzerlandSyrian Arab RepublicTajikistanTanzaniaThailandTogoTrinidad and TobagoTunisiaTurkeyUgandaUkraineUnited KingdomUnited StatesUruguayVenezuela, RBVietnamYemen, Rep.ZambiaZimbabwe Linea del tempo:
Questa scala temporale mostra un grafico dal 1991 anno al 2014 anno. Bahrain. I dati fino ad 1990 anno non disponibili. Il numero di osservazioni attuali secondo i date: 24.
La fonte (nome):
Indicatori dello sviluppo mondiale
La fonte (organizzazione):
World Bank staff estimates based on sources and methods in World Bank's "The Changing Wealth of Nations: Measuring Sustainable Development in the New Millennium" (2011).
Categorie:
Economy & Growth, Environment
sono stati aggiornati
23 apr 2017 anni
Indicatori delle variazioni dei valori per anni
Minima:
-1.248 Mlrd
1 gen 2000 anni
Massimo:
3.088 Mlrd
1 gen 2008 anni
Alla data di osservazione
Valore
Variazione assoluta
La variazione rispetto al valore precedente
1 gen 1991 anni
-1.235 Mlrd
-1.235 Mlrd
0.0%
1 gen 1992 anni
-909.804 Mln
+325.211 Mln
-26.33%
1 gen 1993 anni
-1.033 Mlrd
-123.213 Mln
13.54%
1 gen 1994 anni
-992.078 Mln
+40.939 Mln
-3.96%
1 gen 1995 anni
-602.775 Mln
+389.302 Mln
-39.24%
1 gen 1996 anni
-534.59 Mln
+68.185 Mln
-11.31%
1 gen 1997 anni
-806.789 Mln
-272.199 Mln
50.92%
1 gen 1998 anni
-822.64 Mln
-15.851 Mln
1.96%
1 gen 1999 anni
-890.017 Mln
-67.377 Mln
8.19%
1 gen 2000 anni
-1.248 Mlrd
-358.062 Mln
40.23%
1 gen 2001 anni
-659.478 Mln
+588.601 Mln
-47.16%
1 gen 2002 anni
-1.078 Mlrd
-418.111 Mln
63.4%
1 gen 2003 anni
-417.334 Mln
+660.256 Mln
-61.27%
1 gen 2004 anni
-571.197 Mln
-153.864 Mln
36.87%
1 gen 2005 anni
-905.121 Mln
-333.924 Mln
58.46%
1 gen 2006 anni
-215.701 Mln
+689.42 Mln
-76.17%
1 gen 2007 anni
1.12 Mlrd
+1.335 Mlrd
-619.08%
1 gen 2008 anni
3.088 Mlrd
+1.969 Mlrd
175.81%
1 gen 2009 anni
1.157 Mlrd
-1.931 Mlrd
-62.54%
1 gen 2010 anni
926.677 Mln
-230.279 Mln
-19.9%
1 gen 2011 anni
1.019 Mlrd
+92.433 Mln
9.97%
1 gen 2012 anni
-795.201 Mln
-1.814 Mlrd
-178.03%
1 gen 2013 anni
583.299 Mln
+1.379 Mlrd
-173.35%
1 gen 2014 anni
-566.464 Mln
-1.15 Mlrd
-197.11%
Classificazione dei paesi secondo i statistiche attuali per anni


Commenti: