29
/it/
it
AIzaSyAYiBZKx7MnpbEhh9jyipgxe19OcubqV5w
April 1, 2024
271818
Uganda
UGA
true
2
1
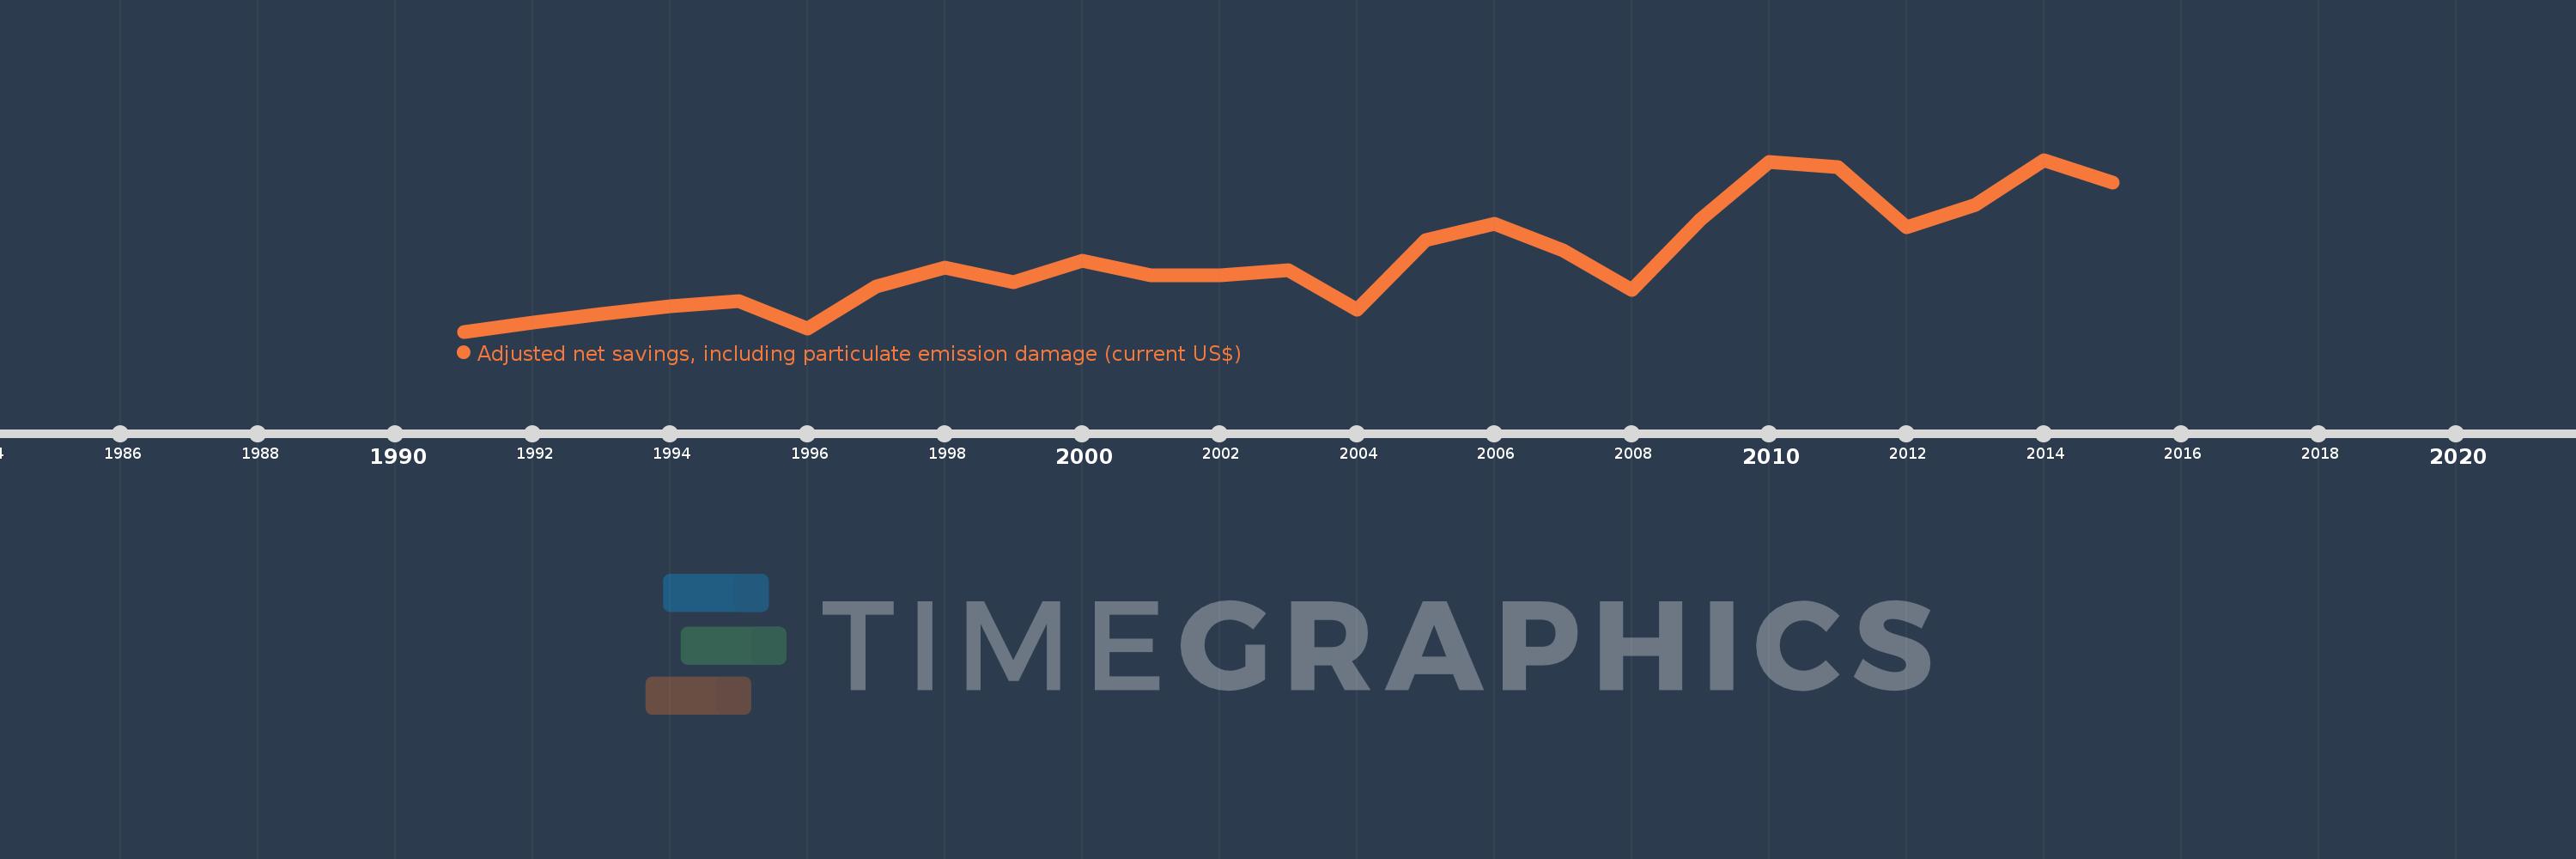
Adjusted net savings, including particulate emission damage (current US$)
2015,2014,2013,2012,2011,2010,2009,2008,2007,2006,2005,2004,2003,2002,2001,2000,1999,1998,1997,1996,1995,1994,1993,1992,1991
Queste statistiche in altri paesi:
AfghanistanAlbaniaAlgeriaAngolaArgentinaArmeniaAustraliaAustriaAzerbaijanBahamas, TheBahrainBangladeshBarbadosBelarusBelgiumBelizeBeninBhutanBoliviaBotswanaBrazilBrunei DarussalamBulgariaBurkina FasoBurundiCabo VerdeCambodiaCameroonCanadaCentral African RepublicChadChileChinaColombiaComorosCongo, Dem. Rep.Congo, Rep.Costa RicaCote d'IvoireCroatiaCyprusCzech RepublicDenmarkDominican RepublicEcuadorEgypt, Arab Rep.El SalvadorEquatorial GuineaEritreaEstoniaEthiopiaFijiFinlandFranceGabonGambia, TheGeorgiaGermanyGhanaGreeceGuatemalaGuineaGuinea-BissauGuyanaHaitiHondurasHungaryIcelandIndiaIndonesiaIran, Islamic Rep.IraqIrelandIsraelItalyJamaicaJapanJordanKazakhstanKenyaKorea, Rep.KuwaitKyrgyz RepublicLao PDRLatviaLebanonLesothoLiberiaLibyaLithuaniaLuxembourgMacedonia, FYRMadagascarMalawiMalaysiaMaldivesMaliMauritaniaMauritiusMexicoMoldovaMongoliaMoroccoMozambiqueNamibiaNepalNetherlandsNew ZealandNicaraguaNigerNigeriaNorwayOmanPakistanPanamaPapua New GuineaParaguayPeruPhilippinesPolandPortugalQatarRomaniaRussian FederationRwandaSaudi ArabiaSenegalSierra LeoneSingaporeSlovak RepublicSloveniaSolomon IslandsSouth AfricaSpainSri LankaSudanSurinameSwazilandSwedenSwitzerlandSyrian Arab RepublicTajikistanTanzaniaThailandTogoTrinidad and TobagoTunisiaTurkeyUgandaUkraineUnited KingdomUnited StatesUruguayVenezuela, RBVietnamYemen, Rep.ZambiaZimbabwe Linea del tempo:
Questa scala temporale mostra un grafico dal 1991 anno al 2015 anno. Uganda. I dati fino ad 1990 anno non disponibili. Il numero di osservazioni attuali secondo i date: 25.
La fonte (nome):
Indicatori dello sviluppo mondiale
La fonte (organizzazione):
World Bank staff estimates based on sources and methods in World Bank's "The Changing Wealth of Nations: Measuring Sustainable Development in the New Millennium" (2011).
Categorie:
Economy & Growth, Environment
sono stati aggiornati
23 apr 2017 anni
Indicatori delle variazioni dei valori per anni
Minima:
-606.593 Mln
1 gen 1991 anni
Massimo:
1.033 Mlrd
1 gen 2014 anni
Alla data di osservazione
Valore
Variazione assoluta
La variazione rispetto al valore precedente
1 gen 1991 anni
-606.593 Mln
-606.593 Mln
0.0%
1 gen 1992 anni
-518.975 Mln
+87.619 Mln
-14.44%
1 gen 1993 anni
-435.749 Mln
+83.226 Mln
-16.04%
1 gen 1994 anni
-366.92 Mln
+68.829 Mln
-15.8%
1 gen 1995 anni
-318.552 Mln
+48.368 Mln
-13.18%
1 gen 1996 anni
-578.465 Mln
-259.913 Mln
81.59%
1 gen 1997 anni
-177.037 Mln
+401.428 Mln
-69.4%
1 gen 1998 anni
192.736 Mille.
+177.23 Mln
-100.11%
1 gen 1999 anni
-135.387 Mln
-135.58 Mln
-70.34 Mille.%
1 gen 2000 anni
71.093 Mln
+206.48 Mln
-152.51%
1 gen 2001 anni
-67.922 Mln
-139.015 Mln
-195.54%
1 gen 2002 anni
-72.165 Mln
-4.243 Mln
6.25%
1 gen 2003 anni
-22.239 Mln
+49.926 Mln
-69.18%
1 gen 2004 anni
-397.225 Mln
-374.986 Mln
1.69 Mille.%
1 gen 2005 anni
262.609 Mln
+659.835 Mln
-166.11%
1 gen 2006 anni
418.652 Mln
+156.043 Mln
59.42%
1 gen 2007 anni
169.634 Mln
-249.018 Mln
-59.48%
1 gen 2008 anni
-212.818 Mln
-382.452 Mln
-225.46%
1 gen 2009 anni
465.963 Mln
+678.781 Mln
-318.95%
1 gen 2010 anni
1.01 Mlrd
+544.497 Mln
116.85%
1 gen 2011 anni
958.989 Mln
-51.471 Mln
-5.09%
1 gen 2012 anni
392.449 Mln
-566.54 Mln
-59.08%
1 gen 2013 anni
600.376 Mln
+207.927 Mln
52.98%
1 gen 2014 anni
1.033 Mlrd
+432.35 Mln
72.01%
1 gen 2015 anni
815.837 Mln
-216.889 Mln
-21.0%
Classificazione dei paesi secondo i statistiche attuali per anni


Commenti: